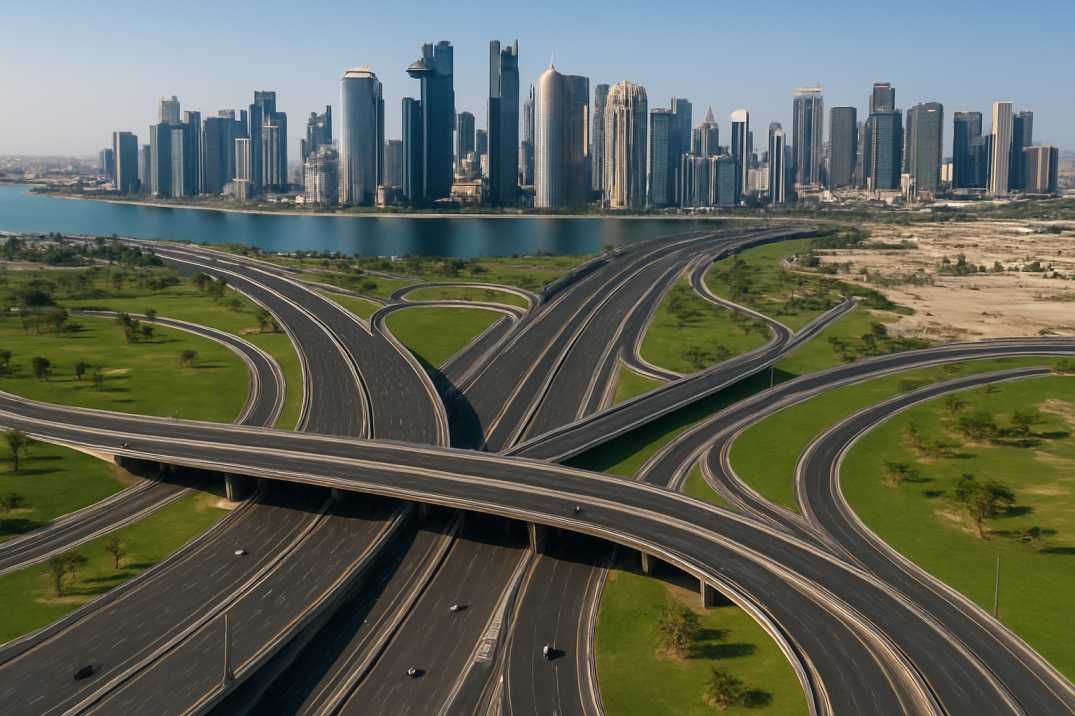
Jalandhar is one of Punjab’s most significant urban centres — a city with deep industrial roots, rapid population growth, and a road network connecting hundreds of thousands of residents and commuters every day. Yet like most Indian municipalities, nobody had a current, standardised picture of what those roads actually looked like.
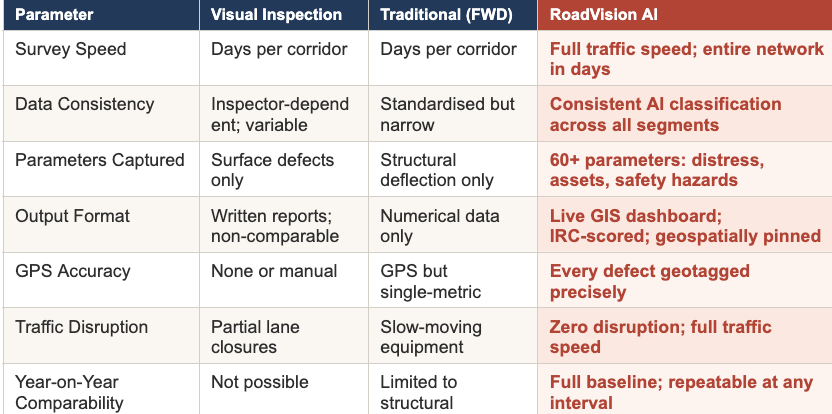
Maintenance decisions were driven by complaint registers, field memory, and periodic visual walk-throughs that produced inconsistent, non-comparable data. There was no baseline. No standardised condition scoring. No way to know whether a stretch that passed inspection one quarter would deteriorate into a safety hazard by the next.
The consequences were predictable: budget wasted on reactive patching, high-severity corridors going undetected, and zero accountability for maintenance quality over time. Manual teams, constrained by time and subjectivity, simply could not keep pace with a network of this scale. AI-based road condition survey, automated road inspection technology, and AI-driven infrastructure monitoring are increasingly becoming essential tools for municipalities trying to manage growing urban road networks.

The RoadVision AI survey of Jalandhar’s urban road network covered more than 200 kilometres — a comprehensive paid pilot across the city’s primary and secondary corridors. What made the deployment remarkable was the methodology: non-disruptive, data-dense, and producing a live GIS-hosted output that planners could immediately act on through AI-powered road survey systems.

Survey vehicles equipped with high-resolution cameras, GPS, and the RoadVision AI data collection app — mounted via a standard suction windshield bracket — drove Jalandhar’s roads at regular traffic speed. No lane closures. No traffic disruption. No specialist mobilisation. The entire 200+ KM network was captured through routine vehicle movement using smartphone-based road inspection technology.
Once footage was uploaded, the RoadVision Intelligence Platform processed the entire dataset across 60+ parameters — covering pavement distresses, safety hazards, and asset conditions — with a verified detection accuracy of 95%. The output was a live, cloud-hosted GIS dashboard where every defect was geospatially pinned, every segment scored against IRC standards, and every asset catalogued in a structured inventory.
Pavement distresses: potholes (all severity levels), alligator cracking, transverse and longitudinal cracking, ravelling, rutting, settlements, shoving, and patching failures. Safety anomalies: missing signage, damaged road markings, and drainage blockages. Condition output: every segment scored on the IRC scale (0–100) with color-coded severity maps on the GIS platform.

The 200+ KM survey covered Jalandhar’s primary and secondary urban corridors — arterial routes, residential connectors, commercial zones, and institutional access roads. Every segment received an individual IRC condition score, a distress-by-type breakdown, and a geospatially mapped defect inventory.
Cracking — in alligator, transverse, and longitudinal forms — emerged as the dominant failure mode, consistent with Jalandhar’s traffic load patterns. Potholes of varying severity were catalogued with precise GPS coordinates. Shoving and rutting, typically indicative of sub-base deformation, were flagged for structural investigation rather than surface-level treatment.


Traditional road surveys in India — whether through visual inspection teams or Falling Weight Deflectometers — require extensive mobilisation, days of field execution per corridor, and produce outputs that are difficult to compare year-on-year.

The Autonomous Road Engineer
AI that is transforming road infrastructure, from reactive to predictive.