Bhilwara is one of Rajasthan's most significant industrial towns — the textile capital of India, with a bustling urban road network connecting residential colonies, industrial zones, and civic infrastructure. Yet for all its economic activity, the city faced a problem that most Indian municipalities share: nobody had a clear, current picture of what the roads actually looked like.
Road maintenance decisions were made through complaint registers, field memory, and periodic visual inspections that produced inconsistent, non-comparable data. There was no baseline. No standardised condition scoring. No way to know whether a road that looked fine in January would deteriorate by July — or whether a patching job actually held.
The consequences were predictable: budget wasted on repeated reactive repairs, high-severity corridors going undetected while low-priority stretches received attention, and zero accountability for maintenance quality over time.
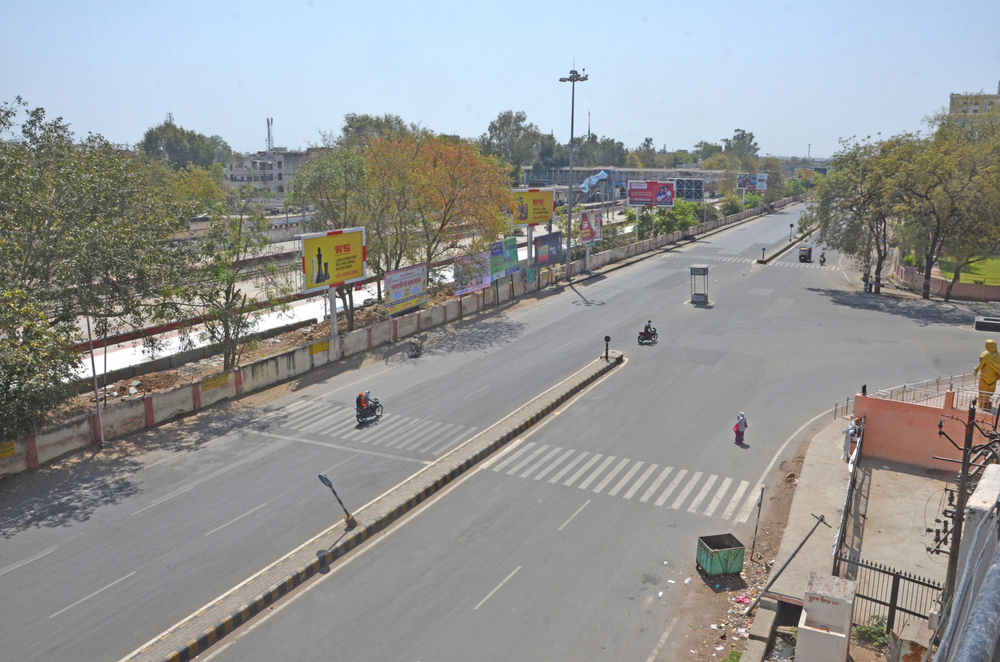
The RoadVision AI survey of Bhilwara's urban road network covered approximately 90 kilometres of roads — a substantial pilot across the city's primary corridors. What made the deployment remarkable wasn't just the scale. It was the speed.
Survey vehicles equipped with high-resolution cameras and GPS units drove Bhilwara's roads at regular traffic speed — no lane closures, no traffic disruption, no special mobilisation. The entire ~90 KM was captured in a single day of fieldwork.
AI Processing: 2 Hours from Raw Video to Actionable Intelligence
Once the footage was uploaded, the RoadVision Intelligence Platform processed the entire dataset in approximately 2 hours. The AI engine analysed every frame across 60+ parameters — covering pavement distresses, road safety hazards, and asset anomalies including encroachments — with a verified detection accuracy of 95%, powered by AI-driven infrastructure intelligence and automated road defect detection.
The output wasn't a static PDF. It was a live, cloud-hosted GIS dashboard where every defect was geospatially pinned, every road segment scored against IRC standards, and every asset catalogued in a structured inventory.


The ~90 KM survey covered several corridors spanning Bhilwara's primary and secondary urban road network — from arterial routes connecting major residential colonies to internal roads serving industrial and commercial zones. Surveyed corridors included R K Colony to Subhash Nagar, Bhilwara–Sanganer Road, Subhash Nagar to R C Vyas Colony, R C Vyas Colony to Vijay Singh Pathik Nagar, and many more across the city. Every road received an individual IRC condition score, a defect-by-type breakdown, and a geospatially mapped distress inventory — all accessible live on the platform.

Bhilwara–Sanganer Road emerged as one of the network's most critical corridors — 97 defects across 1.66 km, dominated by cracking, and an IRC score of 62.07 flagging urgent structural intervention. At the other end of the spectrum, the Subhash Nagar to R C Vyas Colony stretch scored a near-perfect 90.95, confirming that well-maintained segments can be formally validated and protected from unnecessary spending.
Cracking was the dominant distress type across sampled segments — accounting for nearly 60% of recorded defects — pointing to a systemic pattern of surface layer deterioration that, if left unaddressed, accelerates into pothole formation and structural failure. The platform's ability to detect this early, across every road simultaneously, is precisely where AI-powered road monitoring systems create compounding value over time.
Both pre- and post-repair surveys were conducted. This is a fundamental shift in how maintenance accountability works. For the first time, Bhilwara's urban local body has a verifiable, timestamped record of road condition before and after any intervention — making it impossible to sign off on poor quality work without a data trail.
The most significant outcome of this deployment is what it triggered. Following the pilot, the department took the decision to roll out ongoing surveys across the entire city road network — not as a one-off assessment, but as a continuous monitoring system. The pilot proved the model. Now it's being scaled.
Traditional road surveys in India — using visual inspection teams or Falling Weight Deflectometers — typically take weeks to mobilise, days to execute per stretch, and produce inconsistent outputs. Here's how RoadVision AI compares on this deployment:

India has over 6,000 cities and towns. The vast majority of them manage their road infrastructure the same way Bhilwara did before this deployment — through intuition, complaints, and manual inspections that produce data you can't compare year-on-year.
The Bhilwara deployment demonstrates a replicable blueprint: deploy AI-powered survey vehicles, process data in hours rather than weeks, generate standardised IRC-rated condition maps, and establish a living GIS dashboard that planners, engineers, and accountability officers can all access.
The result isn't just a better survey. It's a shift in how a city makes decisions about its physical infrastructure — from reactive and opaque to proactive, evidence-based, and auditable.
Bhilwara didn't just get its roads assessed. It built the foundation for a new standard of urban infrastructure governance — and then chose to take it city-wide.

The Autonomous Road Engineer
AI that is transforming road infrastructure, from reactive to predictive.