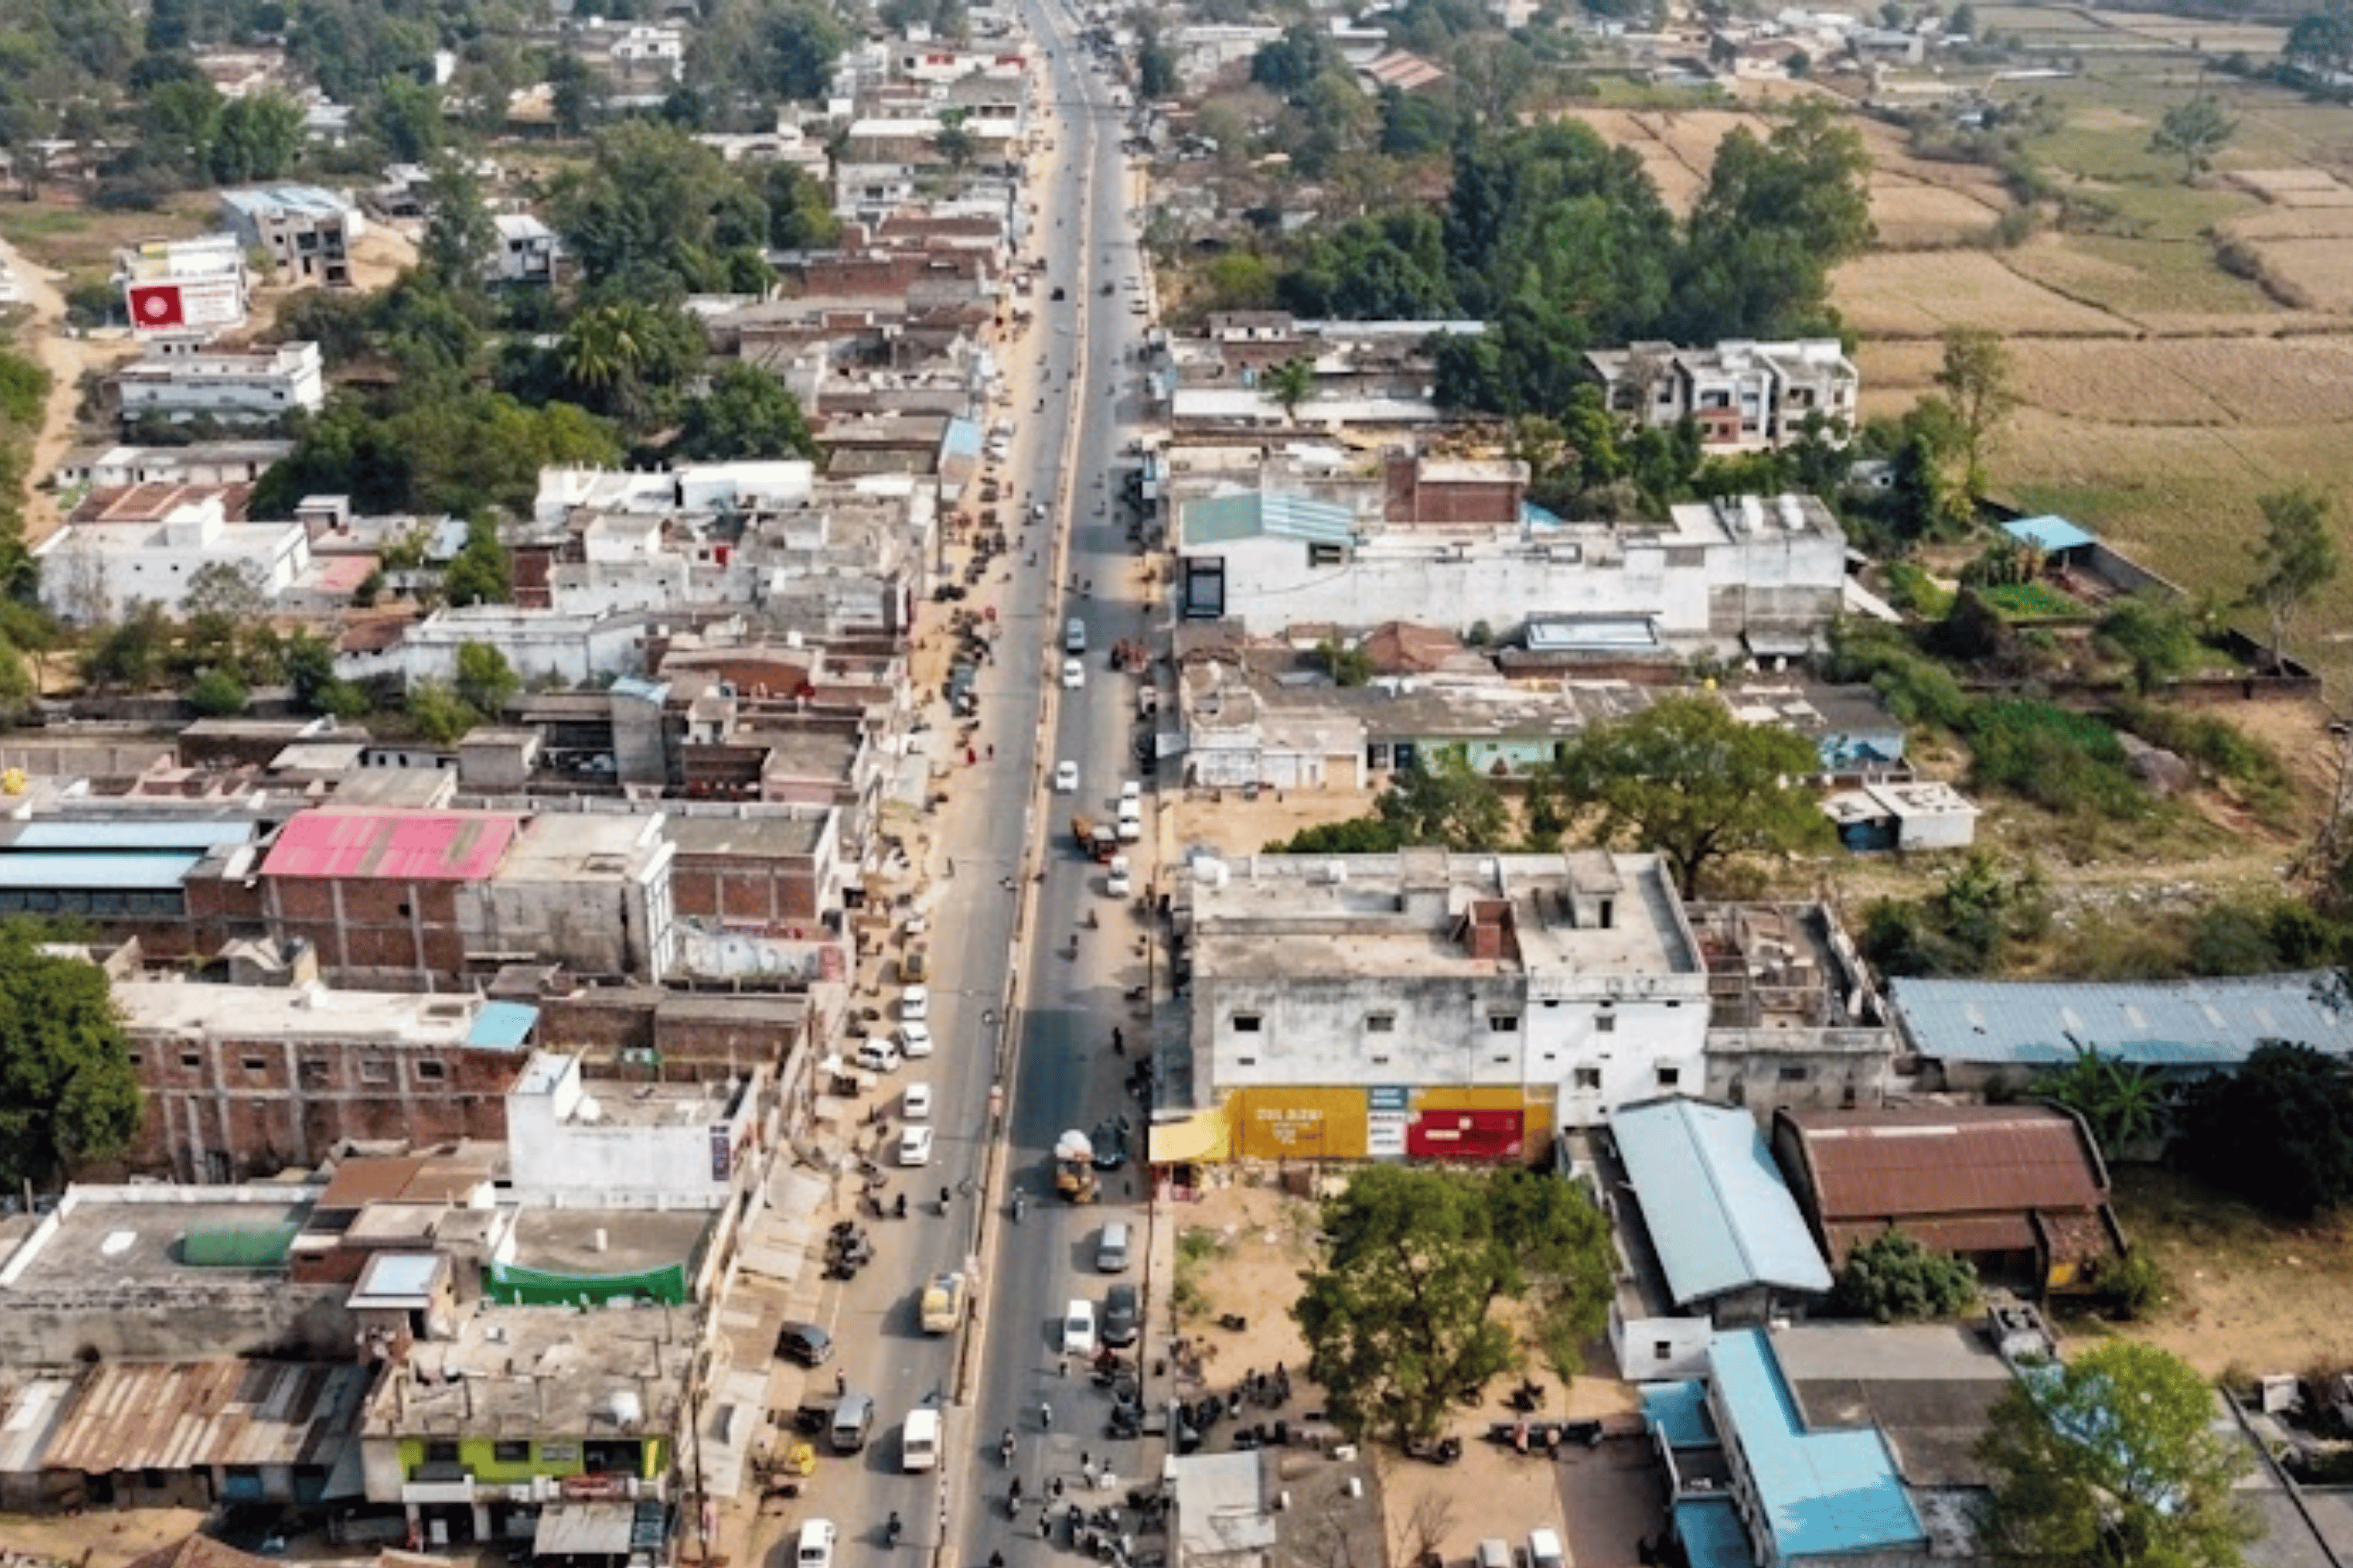
Jalandhar's road network is the circulatory system of a city of over 1 million people. Before this deployment, managing it depended on tools that had not evolved in decades — complaint registers, engineer walk-throughs, and the accumulated memory of a rotating field team,highlighting the need for an AI-based pavement monitoring system.
At 200 km, Jalandhar's road network is too large for any manual inspection regime to maintain current, accurate data across the full system. At any given moment, the condition of most roads was unknown. Decisions were made on partial information.
When engineers retire or transfer, their mental map of the network — which corridors are deteriorating, which repairs are held, which sections are structurally marginal — leaves with them. The city restarts from zero with every personnel change.
Budget allocation and repair prioritisation followed complaint volume rather than actual condition severity. High-traffic corridors near vocal constituents received disproportionate attention while structurally critical but politically quieter roads continued to deteriorate.
Without a GPS-verified pre-repair baseline, there was no objective mechanism to verify whether contractor-executed repairs had actually improved pavement condition. Sign-off was based on visual impression, not measurement.
Road condition was assessed point-in-time, not longitudinally. Without historical condition records, there was no data to identify which roads were deteriorating fastest — making preventive intervention impossible and emergency reconstruction inevitable.

A 200 km network managed by memory and complaint registers is not a road management system. It is organised uncertainty — and the cost accumulates silently until the bill arrives all at once.
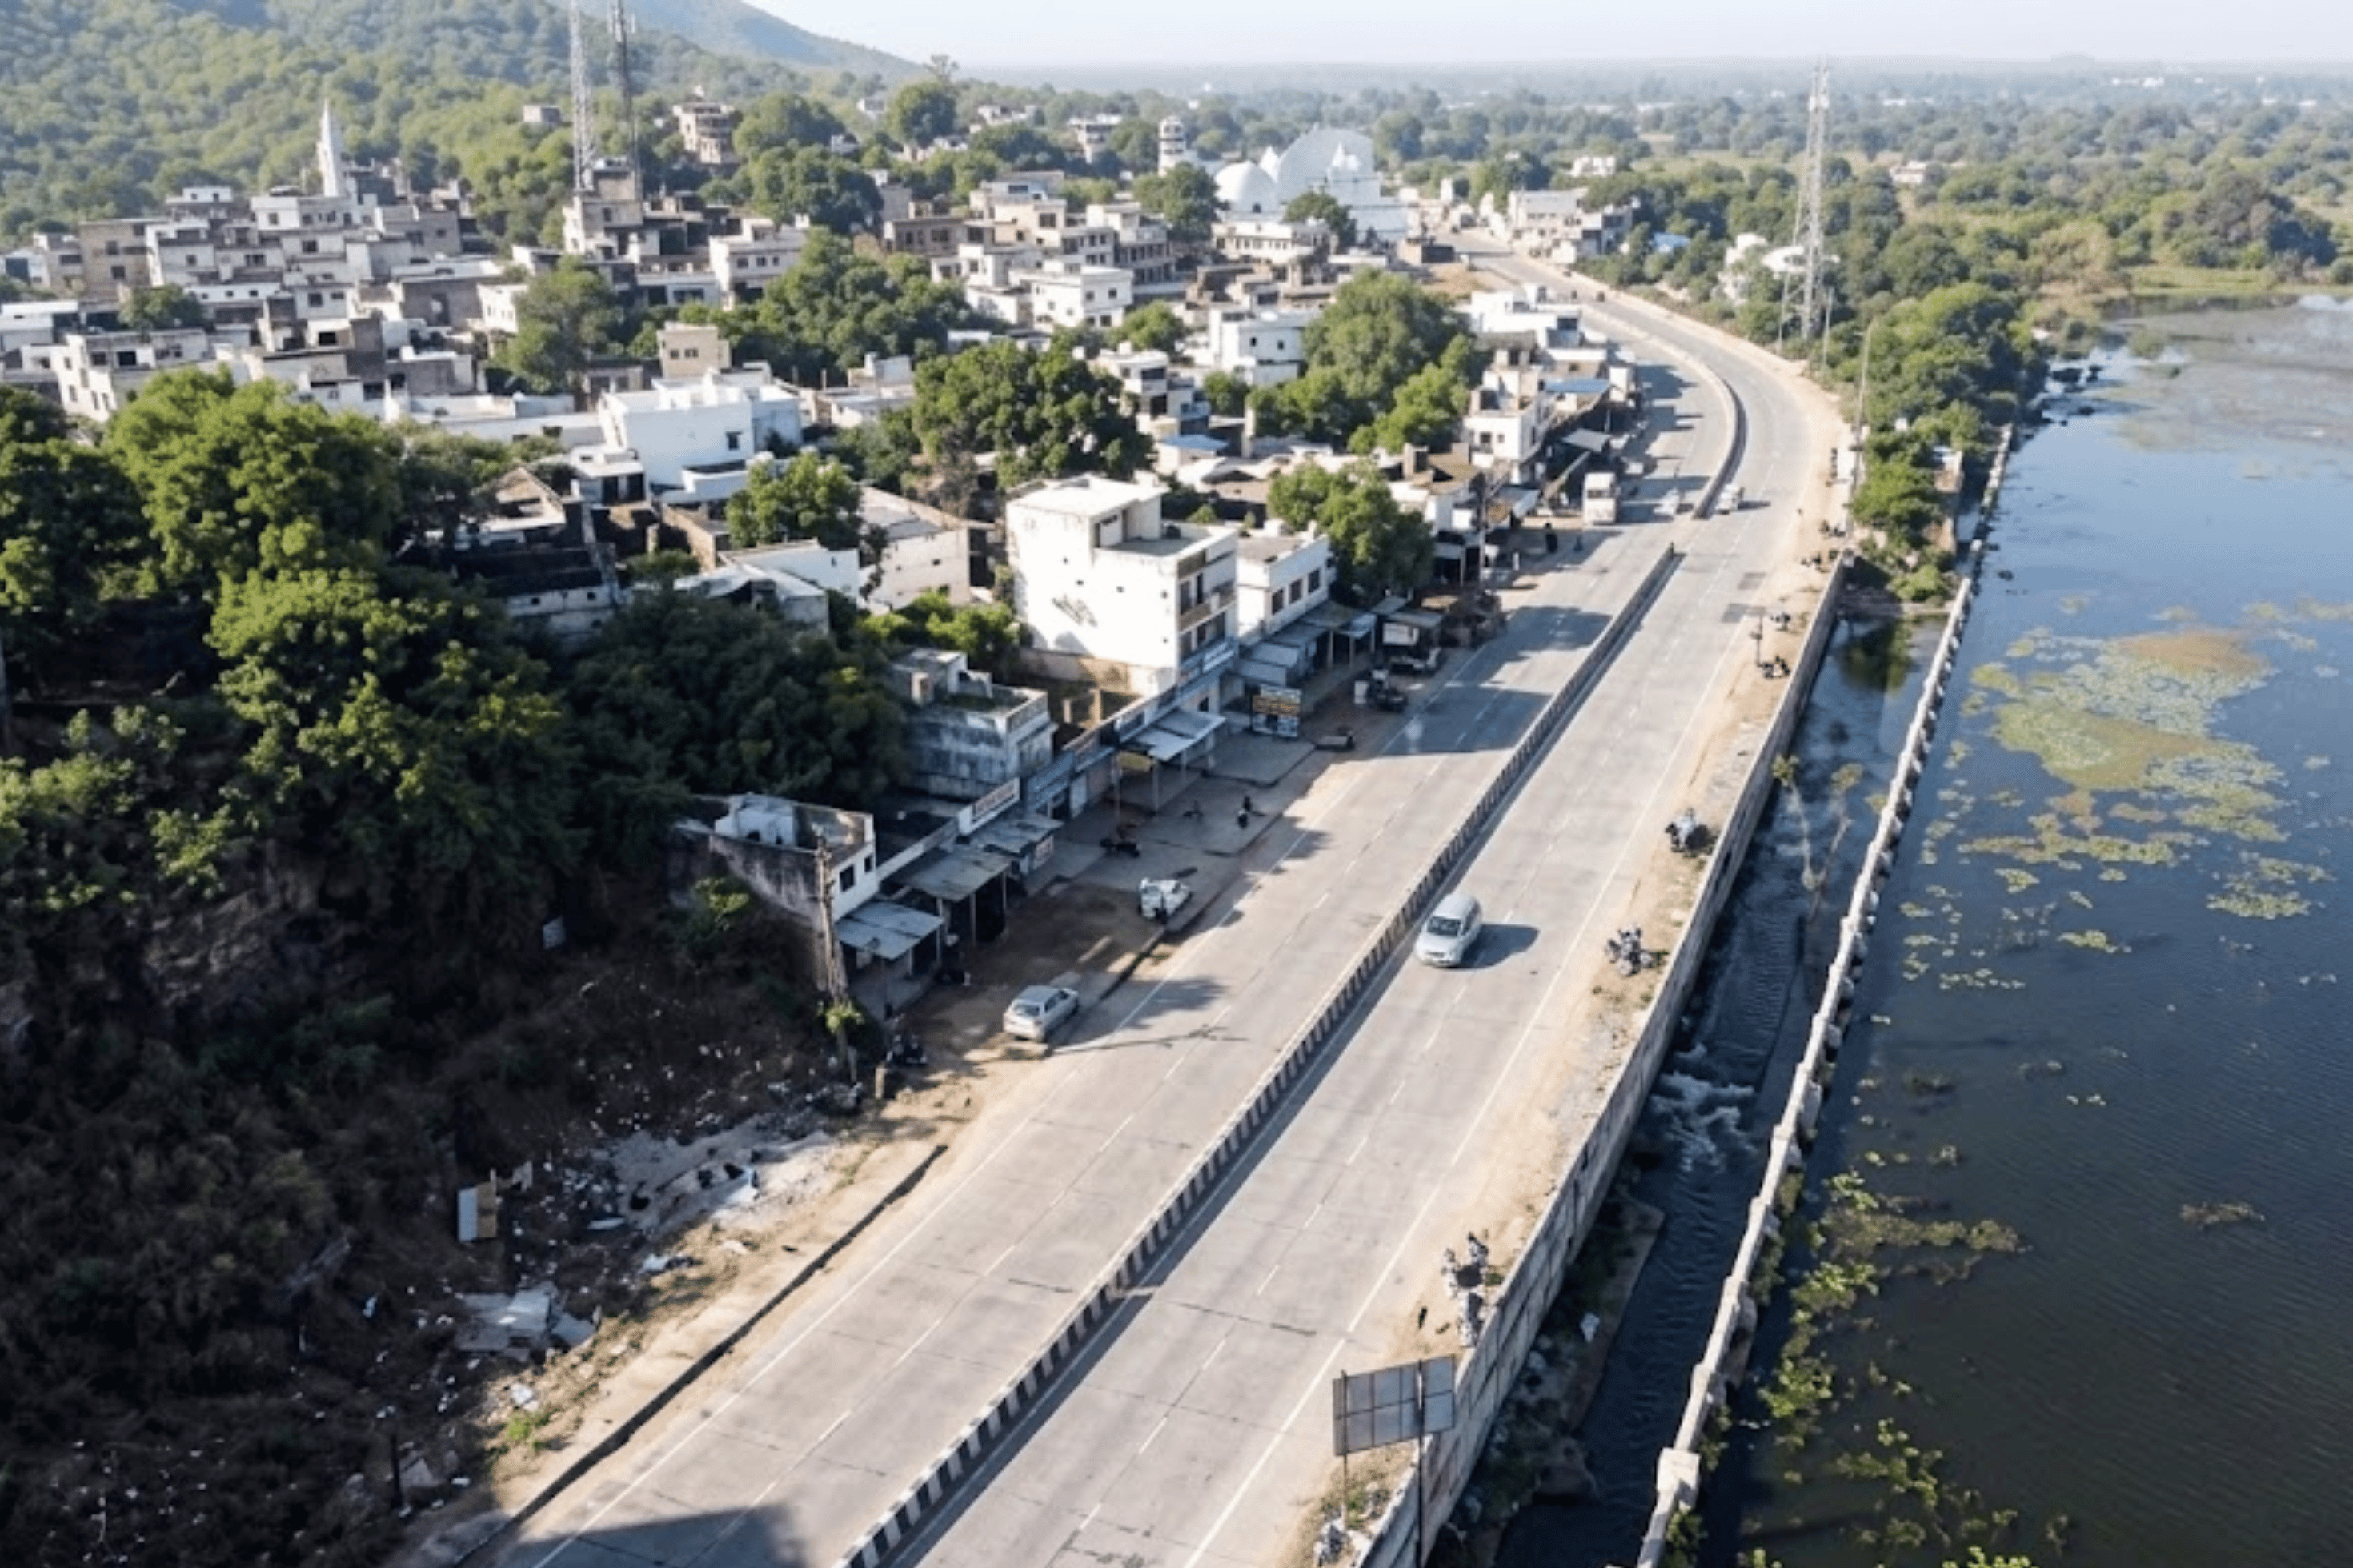
RoadVision AI deployed dashcam-equipped survey vehicles across Jalandhar's full 200 km network — powered by automated road condition monitoring to eliminate manual inspection inefficiencies.
Survey vehicles equipped with high-definition dashcams drove each road corridor at normal traffic speed — both carriageways and service roads included. Every frame was tagged with precise GPS coordinates and timestamps. The entire 200 km network was captured without a single lane closure or field disruption.
Footage was uploaded to the RoadVision AI cloud platform. The deep learning engine analysed every frame automatically, enabling road surface damage detection using AI across pavement condition, safety infrastructure, drainage health, roadside assets, and encroachments.

Each detected defect was GPS-pinned to a specific 100-metre chainage segment. The AI computed an IRC PCI score (0-100) per segment based on defect type, severity, and spatial extent — per Indian Roads Congress methodology. Every segment of Jalandhar's network received a defensible, comparable, auditable condition score.

Results were simultaneously published to a live GIS dashboard accessible to all authorised city personnel and compiled into a formal chainage-wise inspection report. Department heads, planners, and engineers could view the full network health picture within hours of processing completion.
Every metre of every road corridor in Jalandhar is preserved as video — original dashcam footage and AI-annotated playback with detected defects marked in real time. This is not a report that is read once and filed. It is a living evidentiary record.
Raw survey footage from every road organised by corridor, carriageway, and survey date. Every frame GPS-timestamped. Permanently accessible through the platform with no expiry.
The same footage with every detected defect overlaid in real time — bounding boxes, classification labels, severity ratings, and GPS coordinates visible as you watch. Potholes, cracking patterns, rutting, drainage failures, faded markings, missing signage all annotated frame-by-frame.
Compare any road corridor across two survey periods, frame by frame. See exactly how conditions changed between the pre-monsoon and post-monsoon cycle, or verify whether a contractor's repair was held after 90 days. The visual record is irrefutable.
Every road in Jalandhar's 200 km network received a persistent Road ID and a structured Road Register — the platform's living record of that corridor across all past and future surveys.
Each road is assigned a unique Road ID that survives every engineer transfer, every administrative reshuffle, and every political cycle. All future surveys — monthly, quarterly, post-monsoon — automatically map to the same ID. When the next team arrives, the full history is already there.
The platform computes an automated PCI score from 0 to 100 per the Indian Roads Congress methodology — forming a robust AI-based pavement condition monitoring system for objective infrastructure assessment.
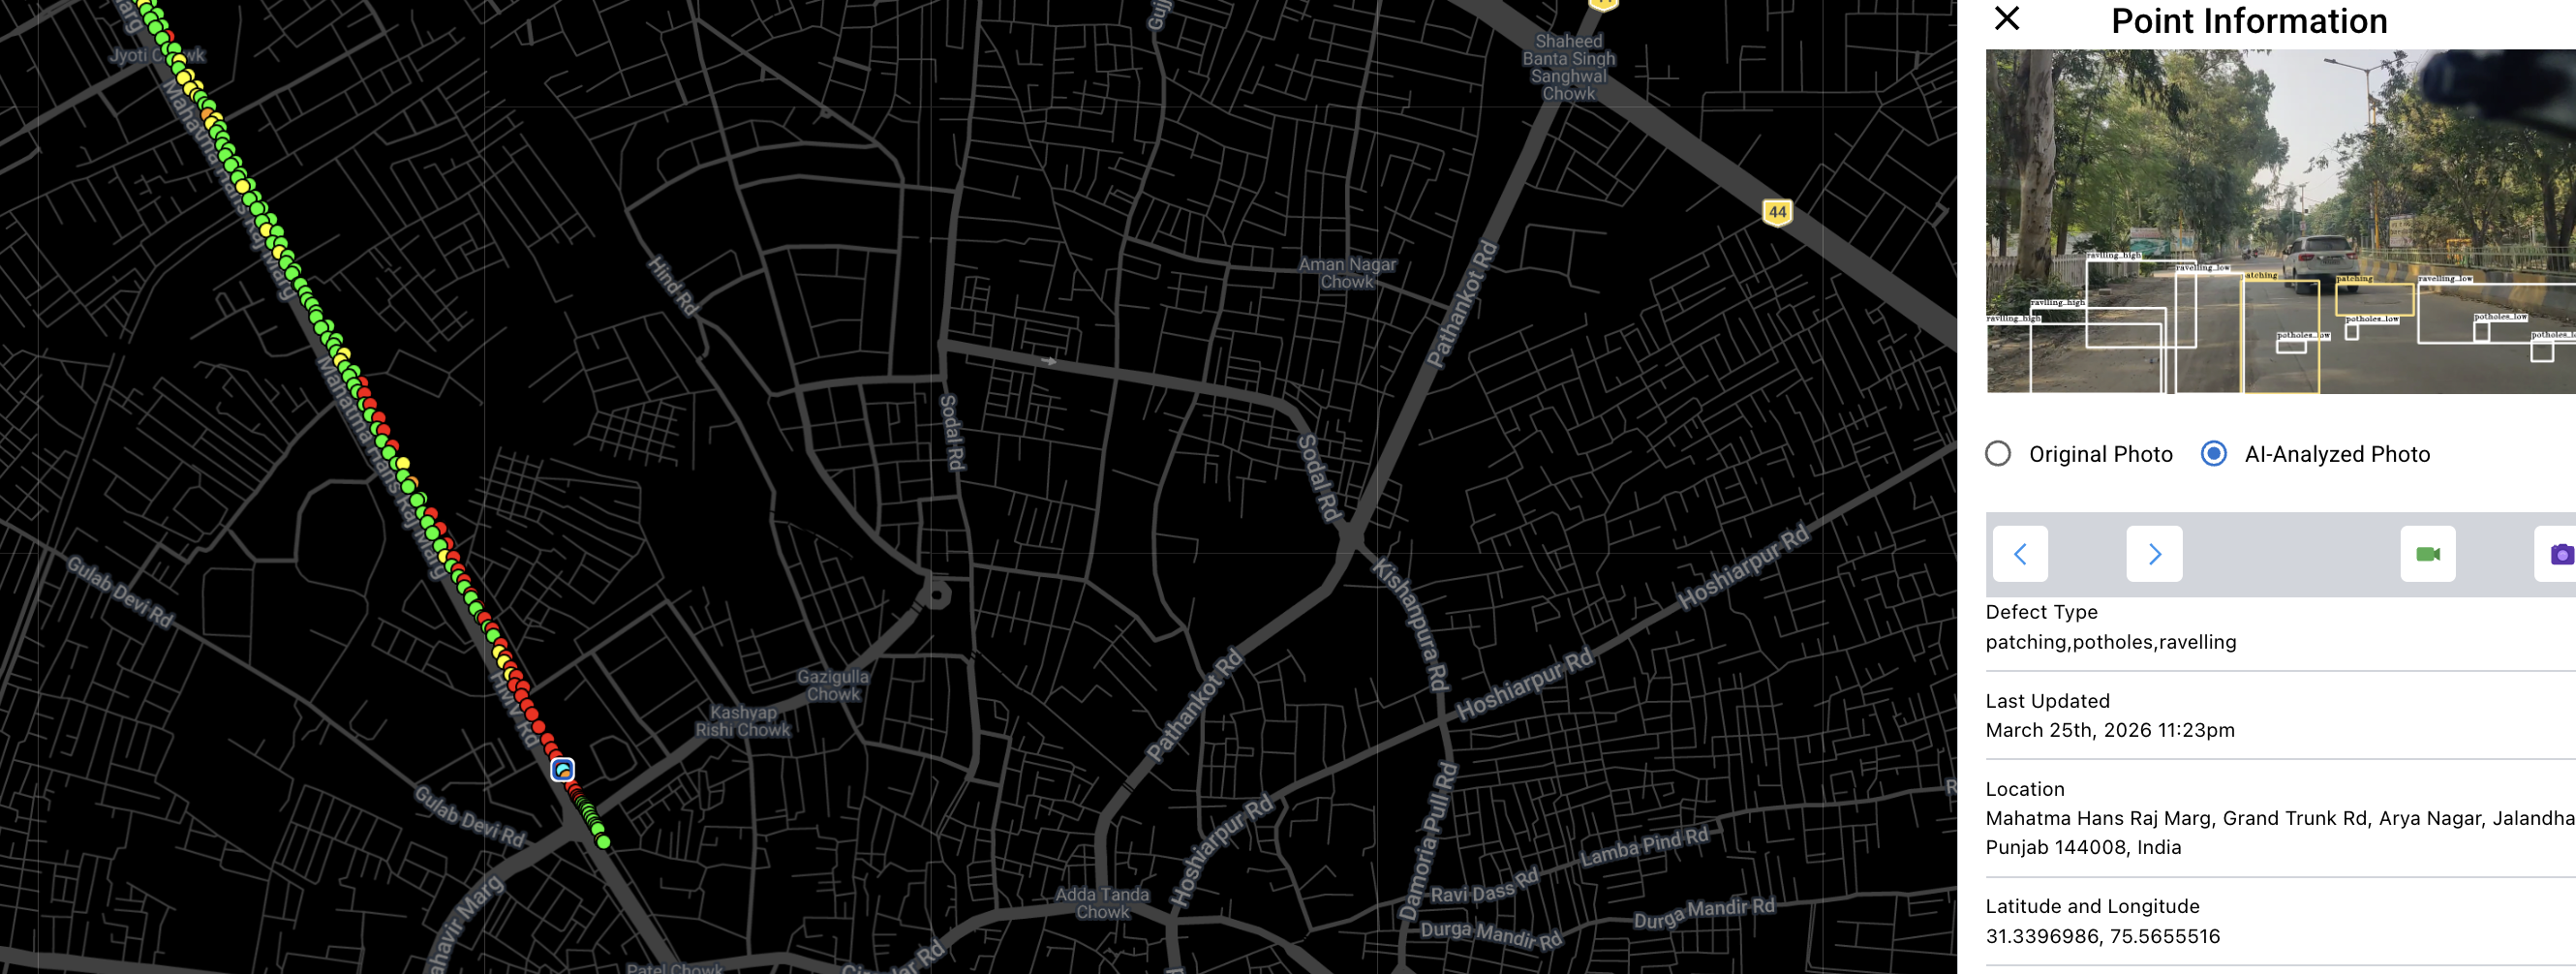
Every detected defect has a GPS-tagged photograph extracted from the survey footage and linked to its exact map location. Each photo carries its severity rating, defect classification, and chainage coordinates. Downloadable in PDF and Excel for work order generation.
For the first time, every authorised department official in Jalandhar can see the full health of the city's road network on a single screen — colour-coded, filterable, and updated with every new survey.
Road segments rendered in green (good, PCI 75-100), amber (fair, PCI 50-74), and red (critical, PCI below 50). The full 200 km network health is visible in seconds. No spreadsheet required to understand where the system is failing.
Every defect marker on the map links directly to the survey photograph from that GPS location — defect type, severity rating, chainage, and survey date all visible on a single click. Decision-makers can access field-level evidence without leaving the platform.

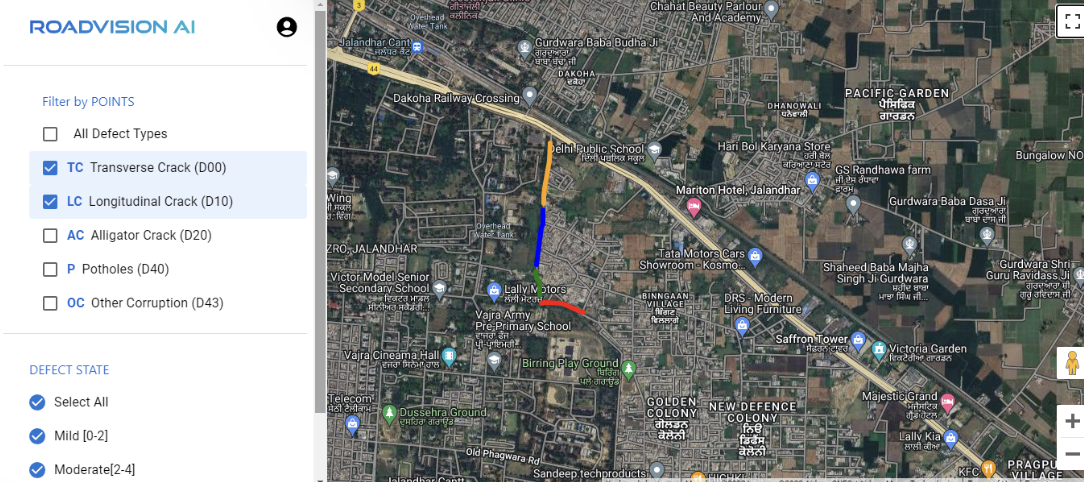
Filter the map by defect type (potholes only, drainage failures only, safety asset conditions), by severity level (high-severity corridors only), by survey period, or by administrative zone. The GIS platform serves the ward councillor, the PWD engineer, and the budget committee — all from the same data source.
Switch to heat map view to identify corridors where multiple defect types cluster together — distinguishing structural failure zones from routine maintenance stretches. This is where the capital budget conversation begins.
From the exact GPS location of a single pothole to the aggregate health score of Jalandhar's full 200 km network — structured intelligence at four levels, each designed for a different decision-maker.

Conduct a post-repair survey and the platform automatically generates a change detection report showing exactly what improved, what deteriorated, and by how much — for every 100-metre segment of every corridor.
The pre-repair survey is a GPS-verified, timestamped record of every defect across Jalandhar's network — PCI scores per segment, photographs per defect, drainage and safety asset conditions — before a single contractor mobilises. This is the accountability document.

Roads that score Good today will not stay Good. The platform flags segments whose PCI is declining between survey cycles — giving engineers the data to schedule preventive resurfacing before structural failure makes intervention ten times more expensive.
Pre- and post-monsoon surveys produce an exact accounting of seasonal infrastructure damage — segment by segment, parameter by parameter. This is the most defensible basis for Jalandhar's annual state government budget request.
The platform does not change Jalandhar's roads overnight. It changes how the city makes every decision about those roads — permanently, enabling autonomous road safety at network scale.
IRC-rated PCI scores per corridor are an objective, methodology-backed evidence base for maintenance budget submissions — to elected bodies, to finance committees, to state government departments. Evidence replaces advocacy.
Engineers generate repair work orders directly from the defect register — GPS coordinates, defect type, severity rating, and priority ranking already computed. No preparation time, no subjectivity, no missed defects.
Pre- and post-repair surveys make accountability structural, not procedural. A road that does not improve measurably cannot be certified. The timestamped GPS trail is permanent and cannot be contested.
The Road ID system means every survey, every repair record, every PCI trend is stored in the platform permanently. When engineers change, the city's knowledge does not change with them.
As the temporal database grows with each survey cycle, the platform identifies deterioration trajectories — flagging which roads are heading toward critical condition before they fail. Preventive treatment costs a fraction of emergency reconstruction.
Jalandhar's deployment at 200 km demonstrates that AI-powered infrastructure intelligence is not a pilot-scale novelty. It is a scalable operating model for any city that has outgrown the capacity of manual road management.
Survey vehicles equipped with high-definition dashcams drove each corridor at normal urban traffic speed. No lane closures, no special mobilisation, no signals to traffic. The full 200 km network was captured in a single continuous field operation with zero urban disruption.
The PCI is a 0-100 rating computed per the Indian Roads Congress methodology — based on AI-detected defect types, severities, and spatial extents per 100-metre chainage segment. It matters for procurement because it provides a methodology-backed, defensible condition score that elected bodies, finance departments, and audit committees can verify. It replaces subjective field assessments with a repeatable standard.
The pre-repair survey creates a GPS-verified, timestamped record of exact defect locations and PCI scores before any intervention begins. Post-repair surveys measure the same GPS coordinates independently. The platform computes the PCI delta per segment automatically — making it structurally impossible to certify a repair without a measurable condition improvement.
RoadVision AI detects 35 parameters across five categories: pavement defects (potholes, cracking, rutting, rain cuts, shoulder irregularity), kerb and median conditions, drainage structure health, road safety features (signage condition, road markings, crash barriers, road studs), and governance indicators (encroachments, unauthorised structures, cleanliness, asset change detection) — all captured in a single survey pass.
Every road is assigned a persistent unique Road ID at first survey. All subsequent surveys — regardless of which engineer conducts them or when — automatically map to the same ID, creating an unbroken cumulative record of condition, repair history, and deterioration trajectory. The platform becomes the city's institutional memory for road infrastructure — one that does not retire or transfer.
Five structured deliverables: (1) a video library with raw and AI-annotated footage for every corridor, (2) a Road Register with IRC PCI scores per road and per 100-metre chainage, (3) a live GIS dashboard with colour-coded condition map and filterable defect markers, (4) analytics at defect, chainage, road, and full-network levels, and (5) before/after comparison reports across survey periods. All outputs available in both PDF and Excel formats in addition to the live platform.
From survey design to live GIS platform — RoadVision AI delivers the full system, not just a report.

The Autonomous Road Engineer
AI that is transforming road infrastructure, from reactive to predictive.
%20(1).png)