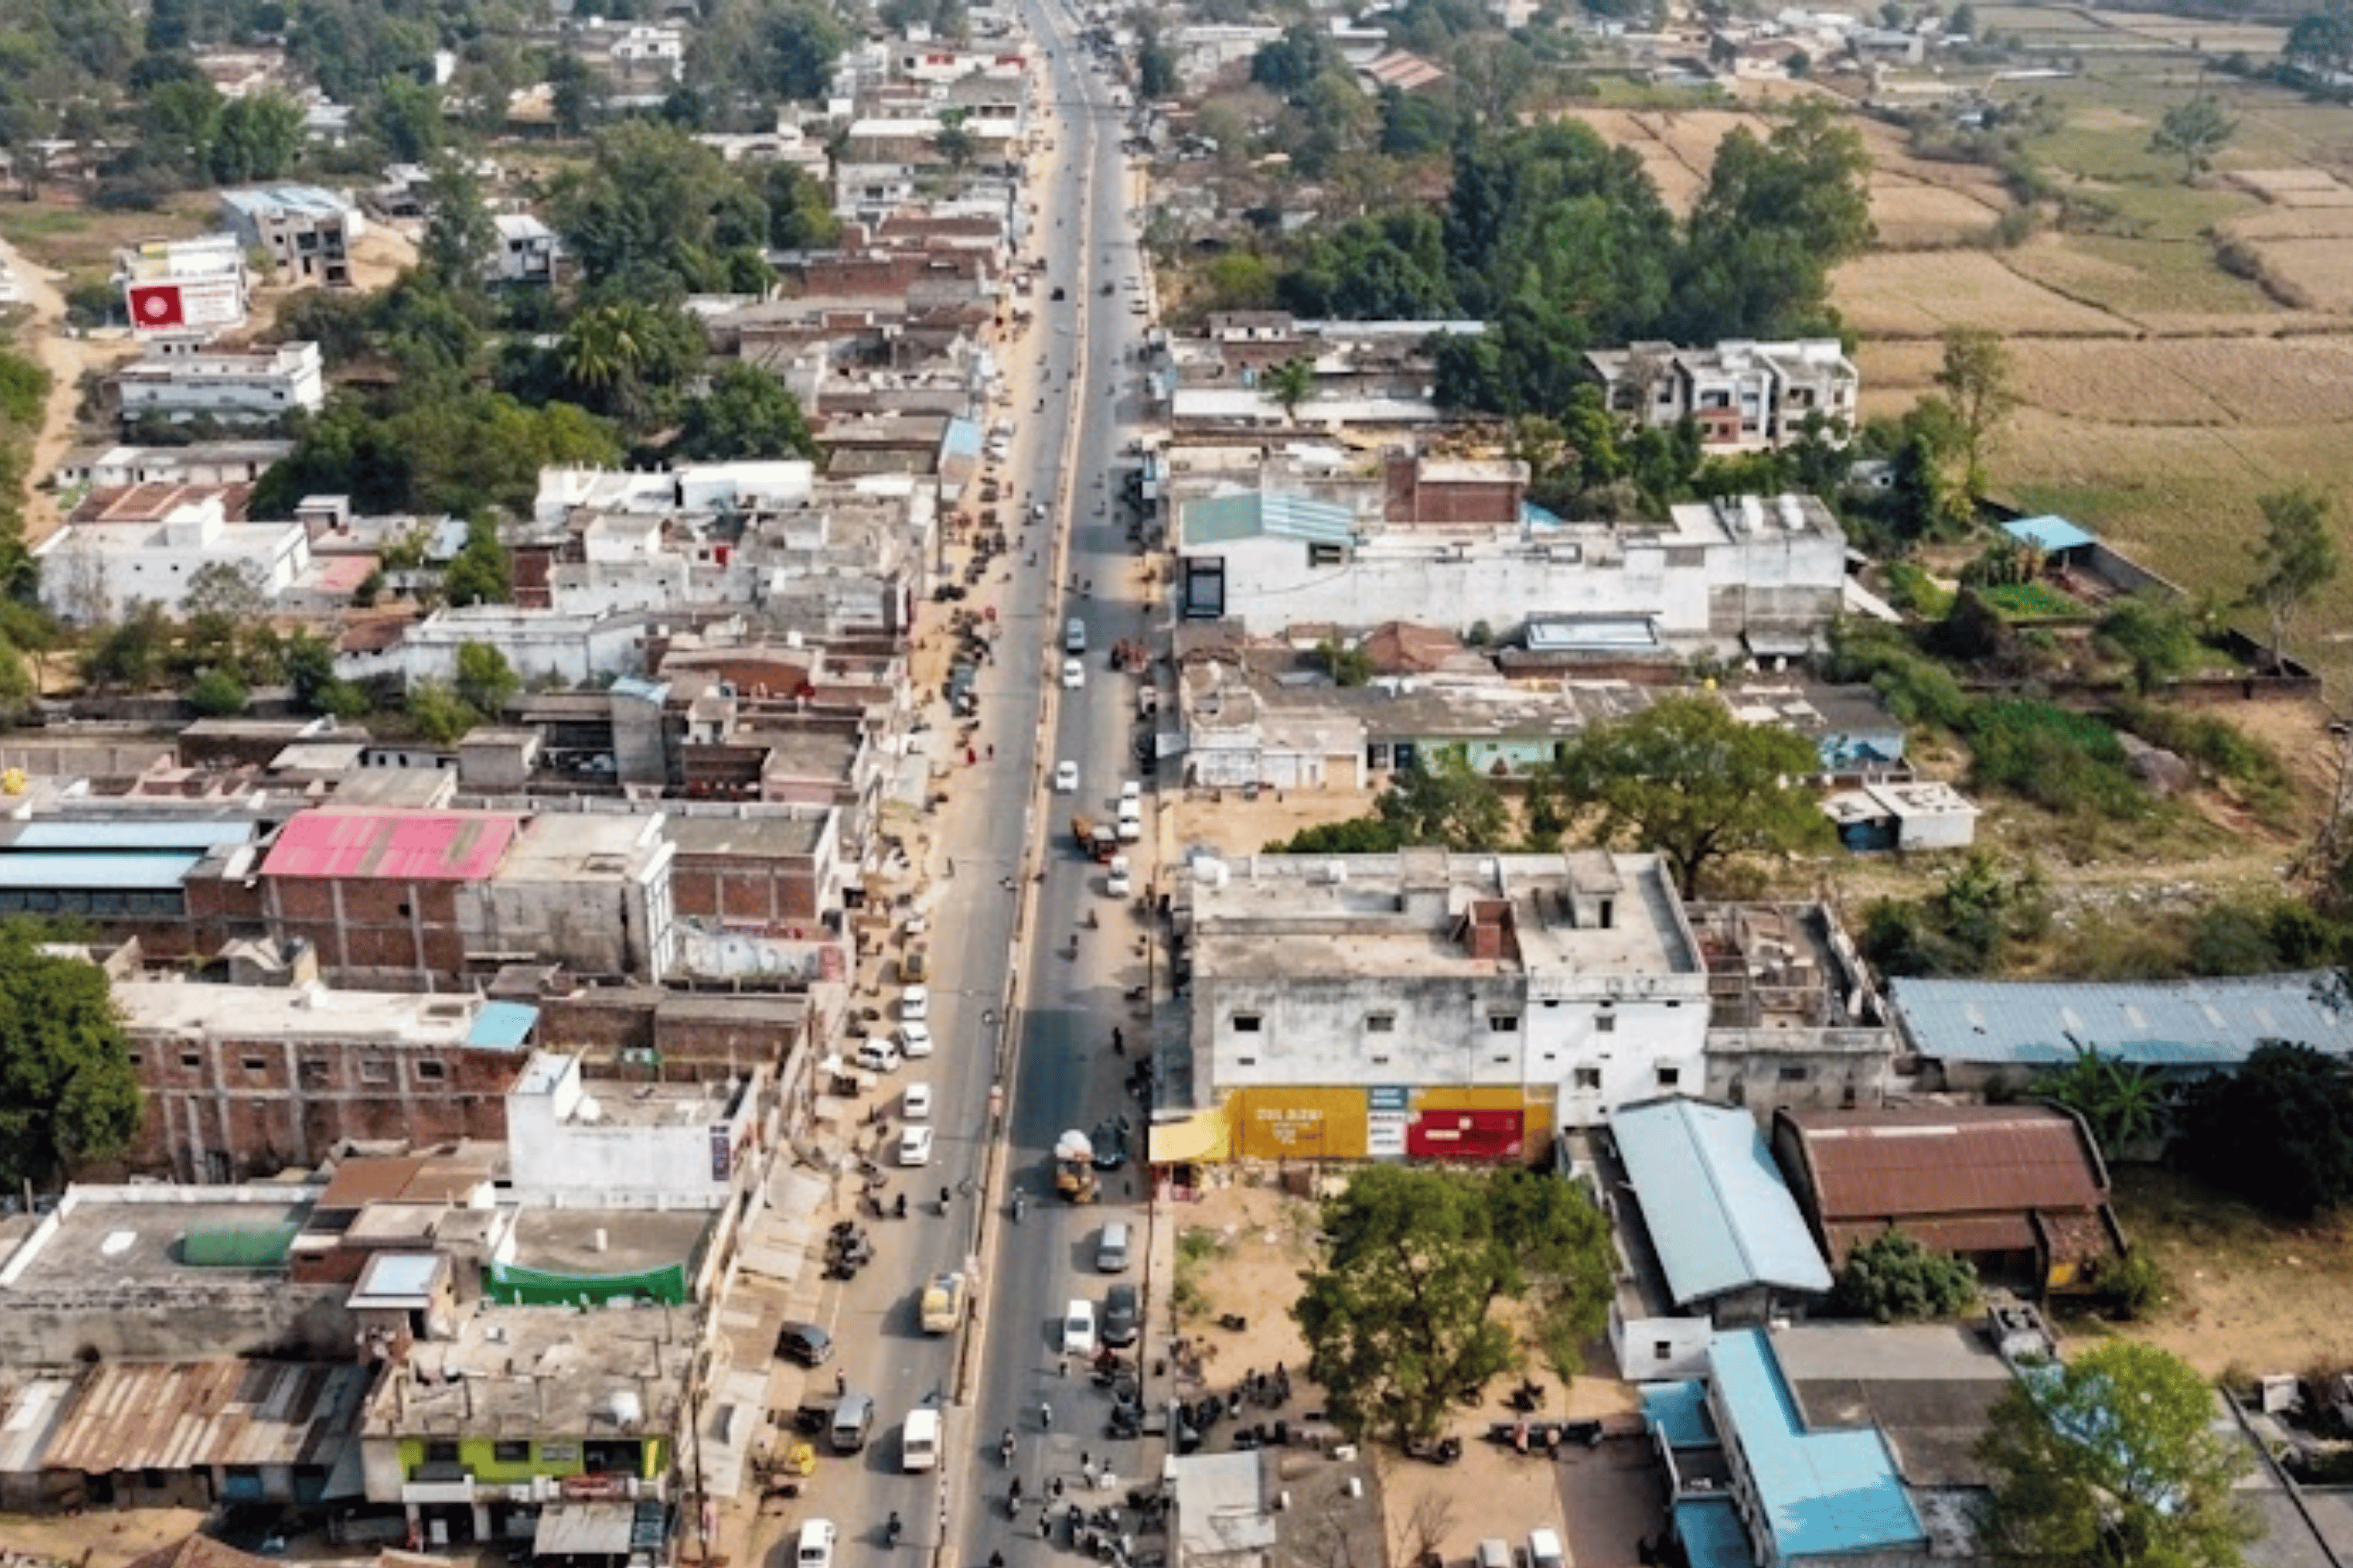
Before this deployment, Bhilwara managed its road network the way most Indian Urban Local Bodies do — through complaint registers, field memory, and periodic visual walk-throughs that produced inconsistent, unauditable, and non-comparable outputs.
Without a consistent condition score, there is no way to track whether roads are improving or deteriorating — or to compare one road against another for budget prioritisation.
Without a pre-repair condition record, contractors can deliver minimum visible compliance. There is no objective way to verify quality without AI-powered road inspection and geospatial road data intelligence.
The budget follows complaints, not condition data. High-severity corridors go underfunded while visibly potholed roads near complaints receive disproportionate attention.
4. No Institutional Memory
Road condition knowledge exists in individuals, not systems. When engineers change, the institutional picture resets — instead of leveraging AI-driven asset management platforms.
When you cannot measure your infrastructure, you can only react — and by then, the cost of repair has already multiplied.
RoadVision AI deployed dashcam-equipped vehicles across Bhilwara. No lane closures, no disruption. Powered by AI road condition survey technology and computer vision for road inspection.

High-definition dashcam mounted on a survey vehicle, driven at 20–30 km/hr across every road — LHS, RHS carriageway, and service roads. Every video frame tagged with precise GPS coordinates and timestamp. Zero traffic disruption, zero lane closures, zero special mobilisation.
All footage uploaded securely to the RoadVision AI cloud. The deep learning engine — trained on multi-year, multi-geography road data — analyses every frame automatically, classifying 35 parameters: pavement defects, safety features, drainage condition, roadside assets, and encroachments. No human annotation required.
Each detected defect is GPS-pinned to a specific 100-metre chainage segment. The AI computes an IRC Pavement Condition Index (PCI) score per segment — from 0 (complete failure) to 100 (perfect) — based on defect type, severity, and extent, per Indian Roads Congress standards. Every road and every segment gets a defensible, auditable score.
Results are published simultaneously to a live GIS dashboard — accessible to all authorised department personnel — and compiled into a formal chainage-wise inspection report. Both outputs are ready within hours of processing completion, not weeks.

Every metre of every road surveyed is preserved as video — both the original dashcam footage and the AI-processed version with detected defects marked in real time. This library is yours, permanently accessible on the platform.

Original dashcam footage from every survey, organised by road and date. Every frame is GPS-timestamped. Permanently accessible — it never expires.
The same footage with every detected defect highlighted — bounding boxes, classification labels, severity ratings, and GPS coordinates overlaid in real time as you watch.
Side-by-Side Comparison for predictive road maintenance AI
Every surveyed road gets a permanent, structured record in the platform — a Road Register with a standardised IRC PCI score that forms the backbone of evidence-based maintenance planning.
Each road is assigned a persistent Road ID in the system. All future surveys automatically map to the same ID — creating a cumulative historical record that survives personnel changes.
An automated PCI score from 0–100 per the Indian Roads Congress methodology — computed per road and per 100-metre segment. Removes subjectivity and gives every road a defensible, comparable rating.

Every defect detected has a GPS-tagged photograph pulled from the survey footage — accessible in the road report and linked to its exact location on the GIS map. Downloadable in PDF and Excel.

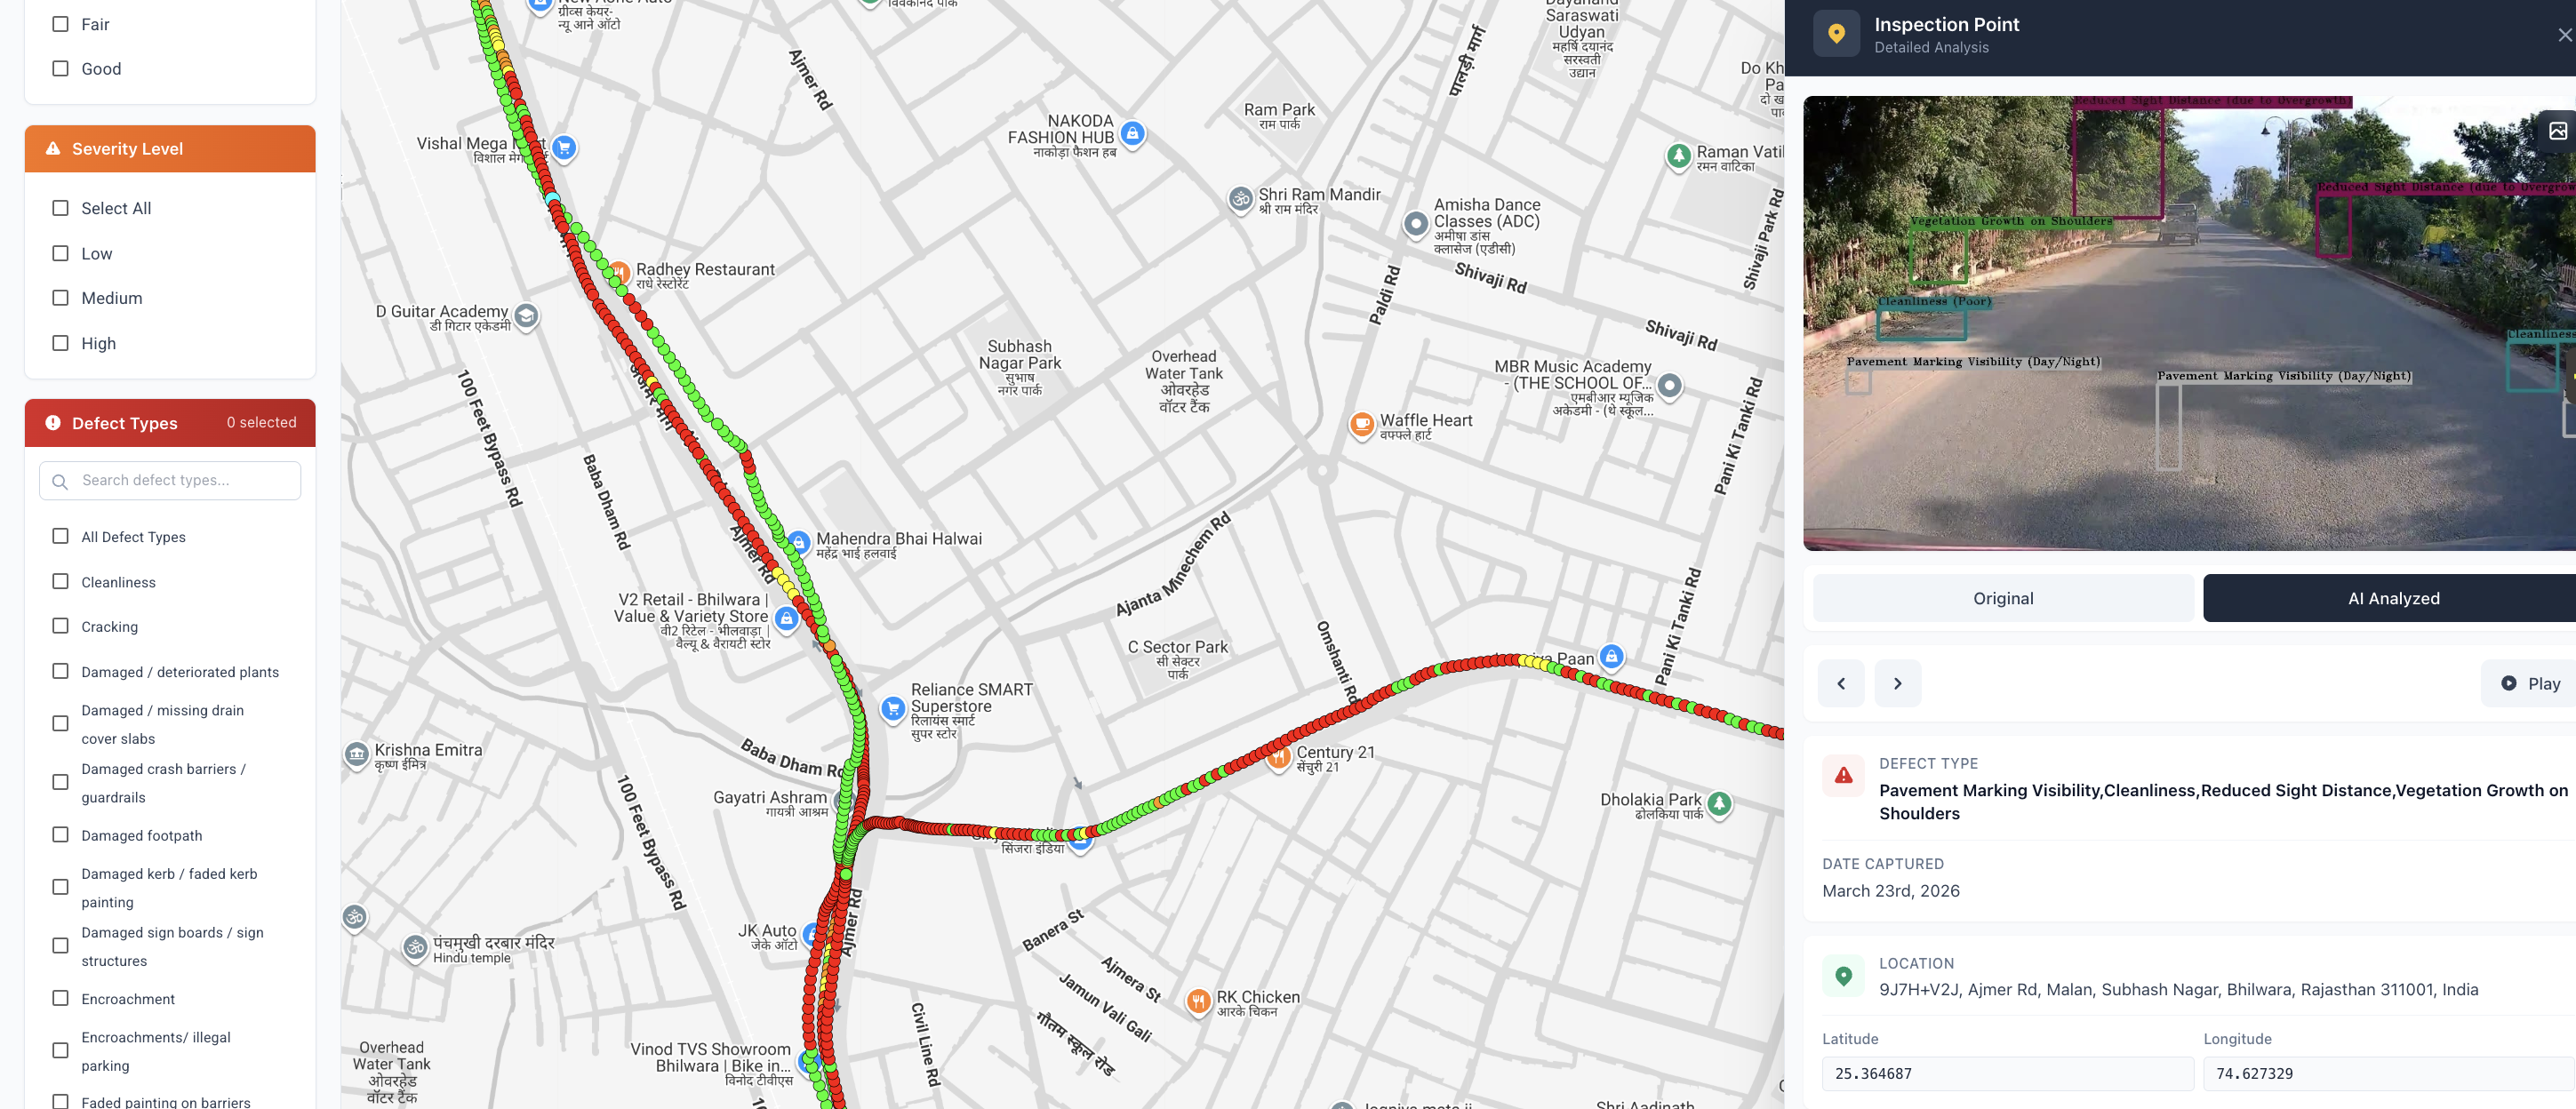
Every defect is plotted on a live interactive map. Road segments are colour-coded by condition severity — giving planners an instant visual picture of where to focus, without reading a single spreadsheet.
The GIS Dashboard provides:

From the exact GPS location of a single pothole to the health score of the entire city network — structured intelligence at four levels, each designed for a different decision-maker.
Individual defects logged with GPS coordinates, photograph, defect type, severity rating, and measurement. Used for generating specific contractor work orders and field repair instructions.
- 35 parameter types · 3 severity levels
Every road divided into 100-metre segments, each with its own IRC PCI score and defect breakdown. Identifies exactly which portion of a road is failing — so repair can be targeted precisely, not applied to the full length.
Comprehensive report per road — overall IRC PCI score, total defect count by type and severity, photo documentation, IRC-referenced remedial recommendations, and historical comparison against previous surveys.
- PDF Download · Excel Datasheet
The network dashboard shows the health of the entire road system at once — what percentage of roads are in good, fair, or critical condition, how the aggregate IRC score has shifted between surveys, and where to concentrate the maintenance budget for maximum impact.


Conduct a second survey after repairs — or on a scheduled cadence — and the platform automatically generates a change detection report showing exactly what improved, what deteriorated, and by how much.
The baseline survey captures each road in its current condition — a GPS-verified, timestamped record of every defect with PCI scores per segment, before a single repair is made. This is what contractors are accountable to.
> Ajmer Chouraha → Sanganer 62.07
> Pragatipath Corridor 40.45
> Mandpiya Section 67.11
> RC Vyas Colony Stretch 74.11
The follow-up survey independently measures the same roads after intervention. The platform computes the exact PCI delta per segment — making it impossible to sign off on substandard repairs without a verifiable data trail.
> Ajmer Chouraha → Sanganer 78.40 ↑
> Pragatipath Corridor 71.20 ↑
> Mandpiya Section 82.60 ↑
> RC Vyas Colony Stretch 88.30 ↑
Work orders are issued against specific defect IDs with GPS coordinates. Post-repair surveys verify completion against the exact same locations — not a general impression of the road.
Good roads today will not stay good forever. The temporal database flags segments whose PCI is declining between surveys, enabling preventive treatment before structural failure sets in.
Conduct surveys pre- and post-monsoon to quantify exactly how much damage the rainy season caused — and where. This data directly informs the annual maintenance budget request to state government.
The data alone changes how decisions are made — within the same budget, the same team, the same city.
IRC-rated PCI scores are an objective basis for maintenance budget requests — far more persuasive than field observations when presenting to elected bodies or state finance departments.
Engineers generate repair work orders directly from the defect list — with GPS coordinates, defect types, severity, and priority ranking already computed by the AI. No guesswork, no manual preparation.
Pre- and post-repair surveys make contractor accountability automatic. A road that does not improve measurably cannot be signed off — the timestamped data trail is permanent and irrefutable.
The output wasn't a static PDF. It was a live, cloud-hosted GIS dashboard where every defect was geospatially pinned, every road segment scored against IRC standards, and every asset catalogued in a structured inventory.
What Was Detected
The Road ID system means every survey builds on the last. When personnel change, the full history of every road — every PCI score, every repair, every deterioration event — remains in the platform.
As the temporal database accumulates, the platform identifies deterioration curves — flagging roads heading toward failure before they fail. Preventive treatment costs a fraction of emergency reconstruction.
Bhilwara's deployment demonstrates a model that scales to any urban body — ULB, municipal corporation, PWD, or NHAI. The methodology, platform, and outputs are consistent regardless of network size.
Field data collection for 80+ KM of urban roads takes 4–5 days using dashcam-equipped vehicles driven at normal traffic speed — no lane closures or special mobilisation required. AI processing of the complete footage takes approximately 2 hours after upload. A full formal report is typically delivered within 4–6 weeks of data collection completion.
The Pavement Condition Index (PCI) is a standardised 0–100 rating per the Indian Roads Congress (IRC) methodology. RoadVision AI calculates it automatically per 100-metre chainage segment using AI-detected defect types, severities, and extents — eliminating the subjectivity and inconsistency of manual visual estimation, and enabling defensible year-on-year comparison across survey periods.
Yes — this is one of the highest-value applications for Urban Local Bodies. By conducting pre- and post-repair surveys, departments get a timestamped, GPS-verified baseline before any intervention and an independent condition measurement after. This creates a structural accountability layer that cannot be disputed, and makes quality-based payment certification objectively possible for the first time.
RoadVision AI detects 35 parameters across five categories: pavement defects (potholes, cracking, rutting, rain cuts, shoulder unevenness), kerb and median conditions, drainage structure health, road safety features (signage, road markings, crash barriers, road studs), and governance issues (encroachments, unauthorised hoardings, cleanliness, asset change detection). All parameters are captured in a single survey pass with no additional equipment.
Every road surveyed is assigned a persistent unique Road ID in the platform. All future surveys — monthly, quarterly, or post-monsoon — automatically map to the same IDs, creating a cumulative temporal database. This enables AI-based deterioration forecasting, maintenance effectiveness measurement through before/after PCI comparisons, and budget optimisation based on predicted condition trajectories rather than complaint patterns or field memory.
The output includes: (1) a video library with raw and AI-annotated footage for every road, (2) a Road Register with IRC PCI scores per road and per 100m chainage segment, (3) a live GIS dashboard with colour-coded condition map and filterable defect markers, (4) structured analytics at defect, chainage, road, and network levels, and (5) before/after comparison reports across surveys. All outputs are available in PDF and Excel formats in addition to the live platform.
From survey design to live GIS platform — RoadVision AI delivers the full system, not just a report.
Book a Demo → roadvision.ai/book-demo

The Autonomous Road Engineer
AI that is transforming road infrastructure, from reactive to predictive.
%20(1).png)