Road agencies and departments of transportation around the world rely on ArcGIS Roads and Highways as the backbone of their road network management. It handles linear referencing, event data, asset records, and reporting workflows that teams have built and refined over years. For most agencies, it is not going anywhere.
But one question is coming up more frequently across transportation teams: how do we bring AI road surveys without dismantling everything we have already built?
This guide is written specifically for road engineering teams and GIS managers who are already working within the ArcGIS ecosystem and are evaluating how AI road condition assessment fits into not on top of their existing setup.
Before covering where AI fits, it is worth being precise about what ArcGIS Roads and Highways actually provides because this determines exactly where an AI layer connects.
ArcGIS Roads and Highways is a linear referencing system (LRS) solution built specifically for departments of transportation. Unlike general-purpose GIS, it models road networks as routes with measure-based location: every asset, condition record, or event on that network is stored not just as a GPS coordinate, but as a position along a named route, defined by a measure value (chainage). This distinction matters for road management because roads change they get realigned, extended, renumbered and the LRS ensures that all historical and current data stays correctly anchored to the network as it evolves.
Highway agencies manage pavement condition assessment data, crash records, sign inventories, speed limits, lane configurations, and surface types often sourced from multiple departments, each using different referencing conventions. ArcGIS Roads and Highways brings these into a single LRS, reconciling different linear referencing methods (mileposts, chainage from origin, administrative section IDs) so data from the public safety department, the maintenance team, and the GIS office all reference the same route network.
When a road is realigned or a route is renumbered, all the events registered against it condition scores, asset records, incident data need to update accordingly. Roads and Highways manages this automatically through configurable event behaviour rules (Stay Put, Move, Retire, Snap), ensuring that data integrity is maintained across network changes without manual re-referencing work.
Every edit in the LRS is time-stamped, giving agencies a full before-and-after history of the network. This enables time-based analysis: how has the condition of a specific corridor changed over successive survey cycles?
Which segments have deteriorated fastest over the past three years?
This temporal dimension is what makes trend-based maintenance planning possible.
Roads and Highways is the platform most commonly used by DOTs to produce HPMS (Highway Performance Monitoring System) submissions and equivalent national reporting requirements in other countries. The Roadway Reporter application generates mileage and segment reports directly from LRS event layers. For agencies accountable to central government funding bodies, this reporting infrastructure is non-negotiable.
Field data collection via ArcGIS Field Maps, work order management via ArcGIS Workforce, spatial analysis in ArcGIS Pro, and enterprise-wide data sharing via ArcGIS Online and ArcGIS Enterprise all connect to the same LRS. The road network data model is the common thread across the entire agency's spatial workflow.
ArcGIS Roads and Highways manages road data with precision. What it does not do is generate it.
The condition attributes, defect records, and asset inventory entries in an LRS are only as current as the last time someone surveyed the network and loaded the results. In practice, for most road agencies, that means:
The result: a well-structured, accurately referenced GIS environment that is populated with data that may be two years out of date and was collected with varying degrees of consistency.
This is not a criticism of ArcGIS. It is a structural limitation of how road condition data has historically been collected. The platform can only work with what it receives.
AI-based computer vision for road surveys addresses the data generation problem directly. The approach is operationally simple: a vehicle-mounted dashcam captures geo-tagged, time-stamped video of the road network as the vehicle drives at normal operating speeds. That footage is processed through AI models that detect and classify road conditions and assets automatically, returning structured, geo-referenced results that load directly into the existing GIS environment.
No specialist survey vehicle. No LiDAR. No dedicated inspection crew driving at 20 km/h with a notebook. Any fleet vehicle maintenance trucks, inspection vans, existing agency vehicles becomes a survey platform.
RoadVision AI's models are trained on over 100 million road images from networks across South Asia, the Middle East, Southeast Asia, Europe, and Africa, covering diverse pavement types, climate conditions, road classifications, and asset configurations. The breadth of training data is what determines whether a model performs accurately outside a controlled test environment on worn rural roads, in harsh light conditions, on non-standard surface types. It is also what removes the need for agencies to train or fine-tune models themselves, which is typically where AI adoption projects stall.
A single dashcam survey pass, processed through the RoadVision AI pipeline, returns intelligence across the following categories:
Detection and classification of surface distress including potholes, longitudinal cracking, transverse cracking, alligator (fatigue) cracking, rutting, edge deterioration, patching quality, and surface ravelling. Each finding is severity-scored (Low / Medium / High / Critical) and contributes to a per-segment Pavement Condition Index (PCI) aligned to ASTM D6433 and IRC:116. An IRI-equivalent roughness value is also returned per 100-metre segment.
Automated detection and classification of 80+ roadside asset Inventory types: regulatory signage, warning signs, informational signs, road markings (centreline, edge line, stop bars, pedestrian crossings, chevrons), kerb and edge conditions, guard rails and safety barriers, crash attenuators, drainage structures, culverts, lighting columns, and ITS infrastructure. Every asset detection includes GPS coordinates, asset type, condition grade, and a photographic evidence frame.
Detection of safety deficiencies including faded or absent pavement markings, damaged safety barriers, vegetation encroachment onto carriageway clearances, sight-line obstructions, and right-of-way intrusions. Outputs are structured against PAS 2161, AASHTO, and IRC safety assessment frameworks.
Identification of roadside vegetation growth that encroaches on carriageway clearance or affects driver visibility, and detection of structures or objects within the right-of-way boundary.
Every detection record includes: defect or asset type, severity or condition grade, confidence score, GPS coordinates, route chainage, timestamp, and a geo-tagged photographic evidence frame.
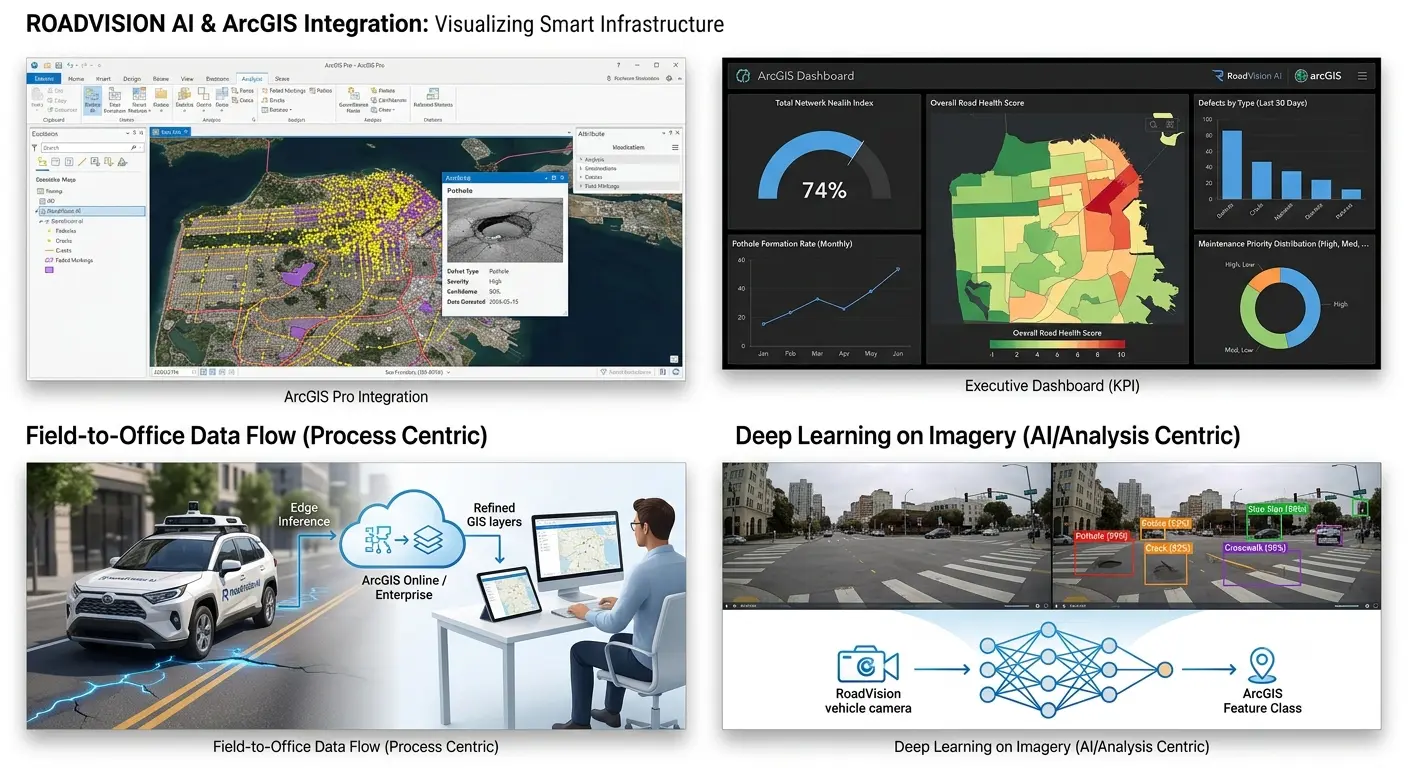
ArcGIS Roads and Highways manages road data as LRS events features attached to route networks at defined from-measure and to-measure positions. For AI survey output to integrate natively into this environment, it needs to speak the same language. RoadVision AI outputs are structured to do exactly that.
Detection results include route ID and chainage values alongside GPS coordinates. This means they load directly as event features in Roads and Highways pavement condition scores, defect records, and asset inventory data attach to the LRS network at the correct measure positions. The coordinate-to-measure translation step that would otherwise require the Linear Referencing Service API is handled on the RoadVision AI side.
For agencies running regular survey cycles, the RoadVision AI pipeline can push processed results directly to an ArcGIS Feature Service endpoint. As survey vehicles complete their routes, updated condition and asset data flows into the GIS environment within hours no manual download, no CSV import, no GIS editor intervention required.
For teams not running a full Roads and Highways LRS deployment, results are available as GeoJSON, Shapefile, or CSV with coordinates for direct import into ArcGIS Online, ArcGIS Pro, or ArcGIS Enterprise as feature layers.
Once loaded, the data participates in every downstream workflow the agency already runs: condition heatmaps on the network map, worst-performing segment queries, photographic evidence review against specific chainage locations, maintenance priority lists, Roadway Reporter mileage and segment outputs, and HPMS attribute population. Teams work in the same ArcGIS environment they have always used the difference is that the condition attributes are current, comprehensive, and consistently classified.
What does not change: The GIS platform. The team's workflows. The reporting structure. The LRS data model. The dashboards. The tools.
What changes: The frequency, coverage, and consistency of the condition and asset data feeding into it.
Survey frequency increases without a proportional cost increase. Because any agency fleet vehicle can serve as a survey platform, the marginal cost of an additional survey pass is low. A network that was assessed every two to three years can be assessed quarterly, or monthly on priority corridors, within a comparable total budget.
Coverage becomes full-network rather than sampled. Traditional survey methods prioritise high-risk corridors or rely on a representative sample because full-network coverage at high frequency is not operationally feasible. AI processing of fleet dashcam footage makes comprehensive network coverage at regular intervals achievable.
Condition classification becomes consistent and auditable. Because the same AI models apply the same classification criteria on every survey run, PCI scores and defect records are directly comparable across time periods, across network sections, and across different survey operators. Trend analysis becomes statistically meaningful.
Asset records become a living inventory. Sign condition, marking visibility, drainage status, and barrier integrity are updated with every survey pass, reducing the gap between the official asset register in the GIS and actual field conditions.
RoadVision AI outputs are aligned to the standards that road agencies are required to report against:
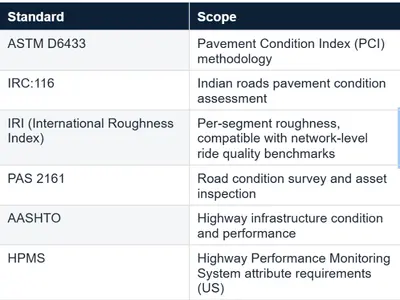
Condition reports generated from the processed survey data are formatted for direct submission to national highway authorities, state road bodies, and international funding institutions.
The evaluation path is designed to be low-friction:
For road agencies evaluating AI survey tools, the practical question is not whether AI-powered road detection is technically viable it demonstrably is. The question is whether it integrates cleanly into the GIS environment the team already operates, without requiring a parallel system, a new interface, or a data re-engineering project. That is what this integration is designed to ensure.
Any GPS-enabled dashcam producing standard MP4 or MOV video at 1080p or above. No proprietary hardware, no calibration rig, no vehicle modifications beyond mounting the camera.
No. The models are pre-trained and deployed. There is no model training cost, no annotation project, and no configuration work required on the agency side. If your road network has specific asset types or classification requirements that differ from standard outputs, these are handled as a configuration on the RoadVision AI side.
Both are supported. For ArcGIS Online, results are delivered as GeoJSON or via Feature Service push to a hosted layer. For ArcGIS Enterprise with Roads and Highways, results are delivered as LRS-compatible event data with route IDs and chainage values. ArcGIS Pro users can import Shapefile or GeoJSON outputs directly.
Standard processing turnaround is 24–48 hours from footage submission, depending on survey volume. For agencies running regular survey cycles with automated push to an ArcGIS Feature Service, the pipeline is configured to deliver results on a defined schedule.
No upfront implementation project, no AI infrastructure build, and no platform migration. The integration requires an API endpoint and a footage submission process. Most agencies are loading first results into their GIS within days of onboarding.
The models operate at over 97% detection accuracy across core pavement distress and asset categories on standard road network footage. Accuracy varies by defect type, lighting conditions, and camera placement detailed accuracy benchmarks by category are available in the technical documentation provided at onboarding.
The Autonomous Road Engineer
AI that is transforming road infrastructure, from reactive to predictive.

.webp)