
Road infrastructure is one of the most valuable public assets any government manages. Yet without a systematic way to measure pavement health, maintenance becomes guesswork reactive, expensive, and unsafe. That is why the Pavement Condition Index (PCI) has become the global standard for evaluating road surface condition, and why pavement condition index software has become an essential tool for every modern road agency.
This complete guide explains what PCI is, how it is calculated, how PCI surveys are conducted, what the limitations of traditional methods are, and how AI-powered pavement condition software is transforming the entire process for agencies managing roads at scale.
Whether you are a road engineer at NHAI, a PWD district officer, a highway concessionaire, or a municipal engineer responsible for city roads, this guide gives you everything you need to understand and implement modern pavement management system.
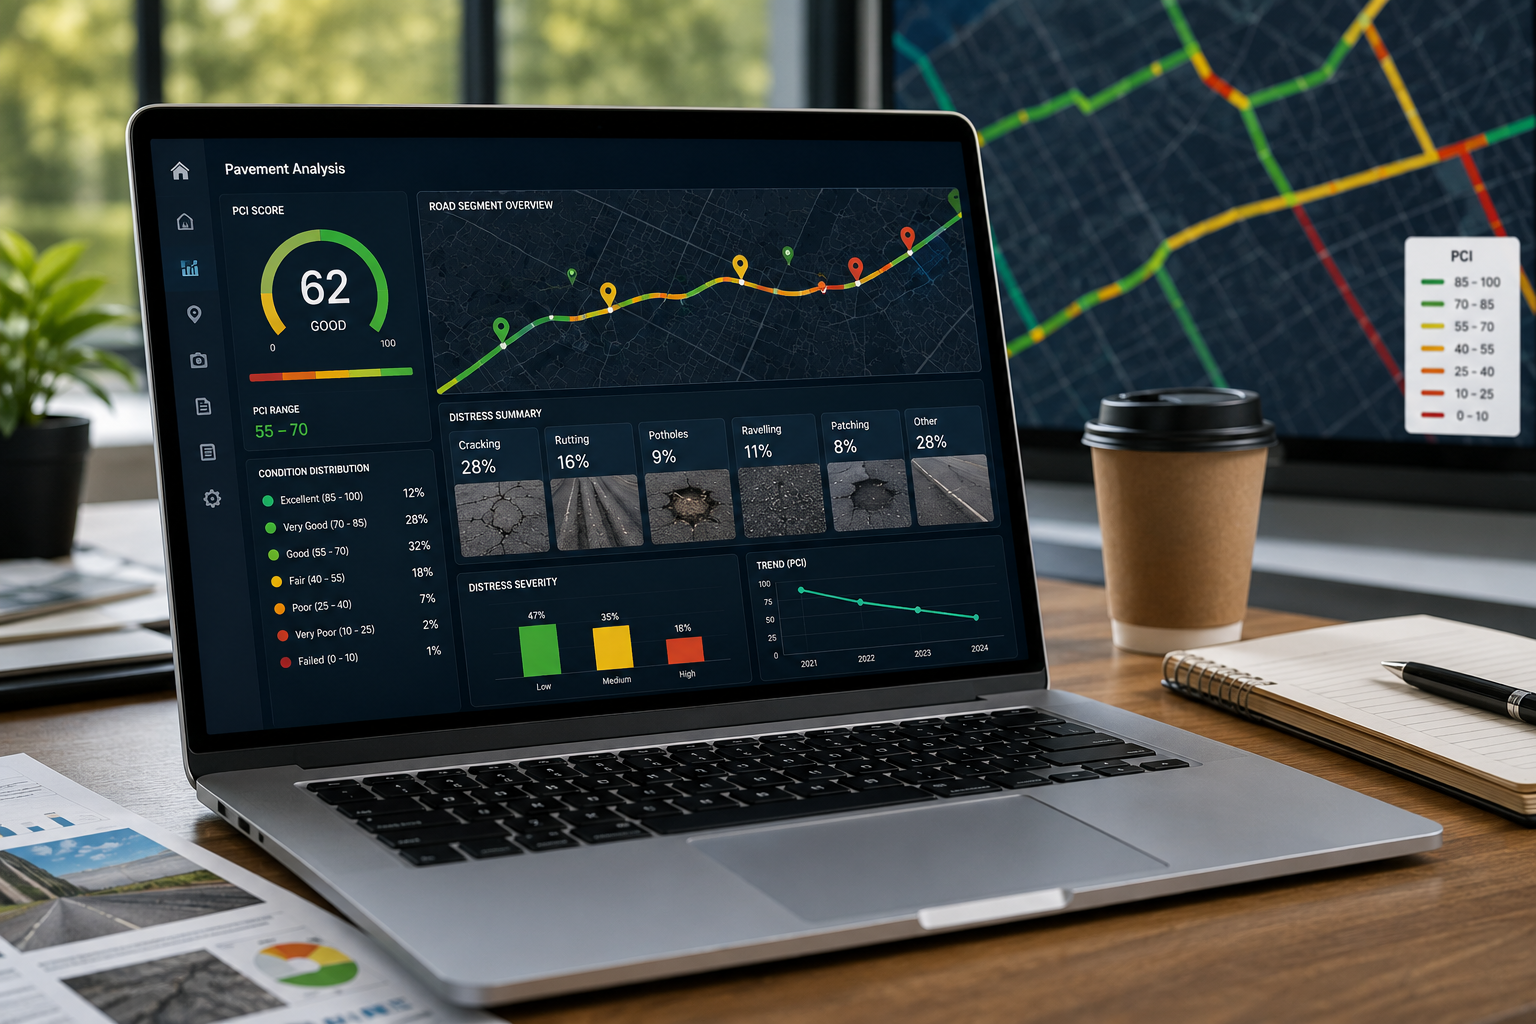
The Pavement Condition Index (PCI) is a standardised numerical rating between 0 and 100 that quantifies the surface condition of a road or pavement section. It was developed by the U.S. Army Corps of Engineers in the 1970s and is now codified in ASTM D6433 the internationally recognised standard for pavement condition assessment.
A PCI of 100 represents a perfect, newly-paved road surface. A PCI of 0 represents complete structural failure. The score is calculated based on the type, severity, and extent of visible pavement distresses observed during a survey. Here is how the scale reads in practice:
A score of 86 to 100 means the road is in Excellent condition routine maintenance only is needed. 71 to 85 is Good, where preventive treatments like crack sealing are appropriate. 56 to 70 is Satisfactory, meaning preventive rehabilitation should be scheduled. 41 to 55 is Fair surface rehabilitation needs to be programmed soon. 26 to 40 is Poor, requiring major rehabilitation. 11 to 25 is Very Poor, where reconstruction is being considered. Anything from 0 to 10 is Failed immediate reconstruction is required.
The power of PCI lies in its standardisation. A PCI score of 65 in Delhi means the same as a PCI of 65 in Chennai enabling consistent benchmarking, budget comparisons, and maintenance planning across entire road networks.
Roads do not deteriorate linearly. A road at PCI 70 may drop to PCI 40 twice as fast as the same road would have deteriorated from PCI 85 to 70. This acceleration effect means that early intervention is dramatically cheaper than delayed repair.
Studies consistently show that repairing a road at PCI 65–70 costs approximately 4–5 times less than rehabilitating the same road once it has deteriorated to PCI 25–35. Without regular automated pavement condition monitoring, agencies invariably miss the optimal intervention window and face far higher lifecycle costs.
PCI data enables road agencies to identify deteriorating pavement sections before they become critical, prioritise maintenance budgets based on objective condition evidence, schedule preventive treatments at the right point in the deterioration curve, forecast future pavement condition and maintenance costs, maintain compliance with infrastructure standards including IRC, NHAI, and MoRTH guidelines, and justify maintenance expenditure to auditors, concessionaires, and funding bodies.
Understanding how PCI is calculated helps explain why automated pavement condition index software delivers such significant efficiency gains over manual methods.
The road network is divided into sample units — typically sections of 230 square metres for asphalt pavements. These sample units are individually assessed to produce localised PCI scores that are then weighted to produce an overall network or corridor score.
Trained inspectors or AI systems identify and record all pavement distress types present in each sample unit. ASTM D6433 defines 19 standard distress types for asphalt pavements, each of which affects the PCI score differently depending on its severity and extent.
For each distress type identified, the severity is recorded as Low, Medium, or High. The density is recorded as the percentage of the sample unit area affected by that distress. Both inputs are required to calculate the deduct value.
Each combination of distress type, severity, and density produces a deduct value a number representing how much that distress reduces the pavement from a perfect score of 100. Deduct values for all distresses present in the sample unit are summed.
The raw sum of deduct values is adjusted using ASTM standard correction curves to produce a Corrected Deduct Value (CDV), which accounts for the combined effect of multiple distresses occurring together on the same pavement section.
The final calculation is: PCI = 100 minus CDV. The more severe and widespread the distress, the higher the CDV and the lower the resulting PCI score.
ASTM D6433 defines 19 distress types for asphalt (flexible) pavements that must be assessed in a standard automated PCI survey. Modern Automated road assessment software automatically detects and classifies all of these from dashcam or drone video eliminating the need for manual identification in the field.
The 19 distress types are alligator or fatigue cracking, caused by structural failure from repeated loading; bleeding, where excess bitumen migrates to the surface; block cracking, from binder aging and shrinkage; bumps and sags, caused by settlement or frost heave; corrugation, from traffic instability in the surface layer; depression, from settlement or frost action; edge cracking, from lack of lateral support; joint reflection cracking, from movement in underlying layers; lane and shoulder drop-off, from erosion of shoulder material; longitudinal and transverse cracking, from thermal stress or fatigue; large area patching, from previous repair deterioration; small area patching, from previous repair deterioration; polished aggregate, a skid resistance loss from traffic wear; potholes, from advanced fatigue cracking combined with water ingress; railroad crossing deterioration, from settlement at the crossing interface; rutting, the permanent deformation under wheel paths; shoving, the lateral displacement of the surface layer; slippage cracking, from a low bond between the surface and base course; and weathering or ravelling, the surface aggregate loss that reduces durability and skid resistance.
Manually surveying all 19 distress types across a large network requires significant trained manpower. AI road inspection software automates the entire identification and severity classification process making network-wide surveys achievable in a fraction of the time and cost.
Despite PCI being the gold standard methodology, traditional manual survey methods create serious operational challenges especially for agencies managing large road networks.
A standard manual PCI survey requires trained inspectors to physically walk or drive road sections slowly, recording distress types, severity, and extent for every sample unit. For a network of even a few hundred kilometres, this demands multiple field teams operating for weeks or months at substantial cost.
Despite standardised definitions, two qualified inspectors assessing the same pavement section routinely produce PCI scores varying by 8 to 15 points. Severity classifications especially the Low and Medium boundary for cracking are particularly susceptible to individual interpretation. This inconsistency undermines the reliability of network-level condition data and makes year-on-year comparison unreliable.
Traditional PCI surveys involve substantial expenditure on field teams, traffic management, travel, equipment, data entry, and report production. Turnaround from survey to actionable report frequently takes 4 to 8 weeks far too slow for time-sensitive maintenance decisions.
Because manual surveys are so resource-intensive, most agencies conduct them only once every 2 to 3 years. This means rapidly deteriorating sections especially those affected by monsoon damage, overloading, or drainage failure are often missed until they have passed the cost-effective intervention window.
Manual inspection of high-speed highways exposes field engineers to significant traffic risk. Lane closures required for slow-speed survey vehicles also create congestion and secondary accident hazards on live roads.
The road infrastructure industry is undergoing a fundamental transformation. AI-based PCI survey systems automate the most time-consuming and inconsistent elements of traditional pavement assessment delivering faster, more consistent, and more cost-effective results at any network scale.
Modern AI pavement condition monitoring systems use computer vision and deep learning models to analyse video footage collected from vehicle dashcams, drones, smartphones, and vehicle-mounted multi-camera rigs. The AI processes video frame by frame, automatically identifying and classifying all relevant pavement distress types, assigning severity levels, and measuring affected areas at the speed of normal traffic flow. No slow-speed driving, no lane closures, no manual recording on clipboards.
Where a traditional manual team surveys 5 to 20 kilometres per day per team, a single vehicle equipped with Road assessment software can cover 200 to 500 kilometres in the same time at normal highway speeds. For a state highway network of 5,000 kilometres, that difference means weeks of field work versus a few days of driving.
Manual PCI scores vary by inspector. AI-generated PCI scores use the same model, the same classification criteria, and the same distress measurement logic every time, on every road, on every survey cycle. This consistency is critical for reliable year-on-year deterioration tracking and predictive maintenance modelling.
By eliminating large field survey teams, traffic management requirements, and weeks-long data processing cycles, AI-based pavement condition index software typically delivers cost savings of 60 to 80 percent compared to equivalent manual survey programmes while covering far more network per survey cycle.
When evaluating PCI survey software for your agency or project, the most important capabilities to assess are the following.
AI-based automatic distress detection — the software should automatically identify and classify all standard ASTM D6433 distress types, including differentiation between alligator cracking, longitudinal cracking, and block cracking, without manual tagging.
Automated PCI score calculation — the platform should compute PCI scores automatically from detected distress data, aligned with ASTM D6433 or relevant IRC standards, and produce both section-level and network-level scores.
GIS integration and condition mapping — all PCI data should be geo-tagged and visualisable on interactive GIS maps, enabling engineers to see network condition at a glance and filter by score range, road type, or maintenance priority zone.
Cloud-based dashboard and reporting — centralised dashboards accessible to multiple users including field engineers, managers, and decision-makers, with exportable reports compatible with pavement management systems.
Dashcam and mobile survey compatibility — the platform should support standard dashcam or smartphone data collection, not just expensive specialised survey vehicles, to keep collection costs manageable for state PWD and municipal teams.
Deterioration modelling and predictive maintenance — leading platforms use historical PCI trend data to model future pavement deterioration and forecast when sections will reach critical condition thresholds, enabling predictive road maintenance rather than reactive repair.
RoadVision AI's Pavement Condition Intelligence Agent is purpose-built for agencies managing road networks at scale. It automates the full PCI survey workflow from dashcam-based data collection to AI distress detection, automated PCI scoring, and GIS-mapped maintenance reporting.
The platform automatically detects all major pavement distress types from standard dashcam video at normal driving speed, computes AI-generated PCI scores at section, corridor, and network level, generates GIS condition maps with colour-coded severity overlays, captures photographic evidence with GPS coordinates for every flagged defect, tracks deterioration trends across survey cycles, and produces export-ready reports compatible with NHAI, PWD, and municipal maintenance management workflows.
For rapid post-event assessment following floods, landslides, or extreme weather, RoadVision AI's Rapid Road Damage Assessment Agent provides emergency pavement condition mapping within hours of an event enabling agencies to prioritise emergency repair deployment before conditions worsen further.
When pavement condition data needs to be combined with roadside asset inventory signs, guardrails, lighting, drainage structures the Roadside Assets Inventory Agent captures both in a single dashcam survey pass, eliminating the need for separate asset inspection programmes.
The highest-value outcome of implementing modern pavement condition index software is not faster surveys. It is the shift from reactive maintenance to predictive road maintenance.
By tracking PCI scores over multiple survey cycles, AI platforms build a deterioration model for every section of road. This model accounts for traffic loading and heavy vehicle counts, pavement age and structural composition, climate and seasonal effects including monsoon and temperature cycling, and historical repair interventions.
The result is a forecast of when each road section will reach critical PCI thresholds enabling agencies to schedule preventive treatments at precisely the right time, before expensive structural rehabilitation becomes necessary.
Predictive maintenance enabled by AI road condition monitoring consistently delivers a 40 to 60 percent reduction in long-term pavement rehabilitation costs, fewer emergency repairs and traffic disruptions, longer pavement service life through timely preventive treatment, and better budget certainty through multi-year maintenance forecasting.
This is the difference between a road agency that is always reacting to failures and one that is confidently planning years ahead.
The Pavement Condition Index remains the most reliable and widely accepted framework for evaluating road surface health and planning maintenance priorities. But traditional manual PCI surveys are too slow, too expensive, too inconsistent, and too infrequent to meet the demands of modern road network management.
AI-powered pavement condition index software solves every one of these limitations delivering faster surveys, consistent AI-scored results, GPS-mapped reporting, and the predictive maintenance intelligence agencies need to manage road assets cost-effectively at scale.
RoadVision AI's Pavement Condition Intelligence Agent is built specifically for this challenge combining dashcam-based data collection, AI distress detection, automated PCI scoring, and GIS-mapped maintenance dashboards in a single platform designed for Indian road infrastructure.
Book a Demo with RoadVision AI to see how AI-powered pavement condition surveys can transform road management for your network whether you manage national highways, state roads, or city streets.
Q1. What is Pavement Condition Index software?
Pavement Condition Index software is a platform that automates the collection, analysis, and reporting of road surface condition data using the PCI methodology. Modern AI-based PCI software automatically detects pavement distress types from video footage and computes PCI scores without manual inspection teams.
Q2. What does a PCI score of 55 mean?
A PCI score of 55 falls in the Fair condition range, indicating moderate surface distress. At this level, the pavement is approaching the point where deterioration accelerates rapidly. Surface rehabilitation should be programmed promptly waiting until the PCI drops below 40 will result in significantly higher repair costs.
Q3. How is PCI calculated?
PCI is calculated by identifying all pavement distress types in a sample unit, assessing their severity as Low, Medium, or High and their density as the percentage of area affected, converting these into deduct values using ASTM standard curves, computing a Corrected Deduct Value, and subtracting from 100. PCI equals 100 minus the Corrected Deduct Value.

The Autonomous Road Engineer
AI-powered road condition monitoring, asset management, & infrastructure intelligence helping agencies move from reactive maintenance to predictive road management.


.webp)
.webp)
.webp)