
This is a zone-level account from RoadVision AI's road survey programme for Bengaluru, covering the North and Central zones together 407.0 km and 329.2 km respectively, 736.2 km in total. It sets out how the two zones were surveyed, what the data shows about road condition and the defects behind it, and how that picture differs between a fast-growing outer zone and the city's established core.
Bengaluru's North Zone stretches out toward Kempegowda International Airport, Yelahanka and the city's newer growth corridors — 407.0 km of road surveyed, much of it still being built out as the area develops. The Central Zone is the opposite kind of network: 329.2 km through Majestic, Shivajinagar, Vidhana Soudha and the historic core, roads that have carried the city's traffic for decades.
Surveying both zones under the same methodology makes it possible to compare them on equal terms — something a zone-by-zone paper record never allows. The two networks turn out to be in different shape for reasons that have more to do with how each area grew than with how recently its roads were built.
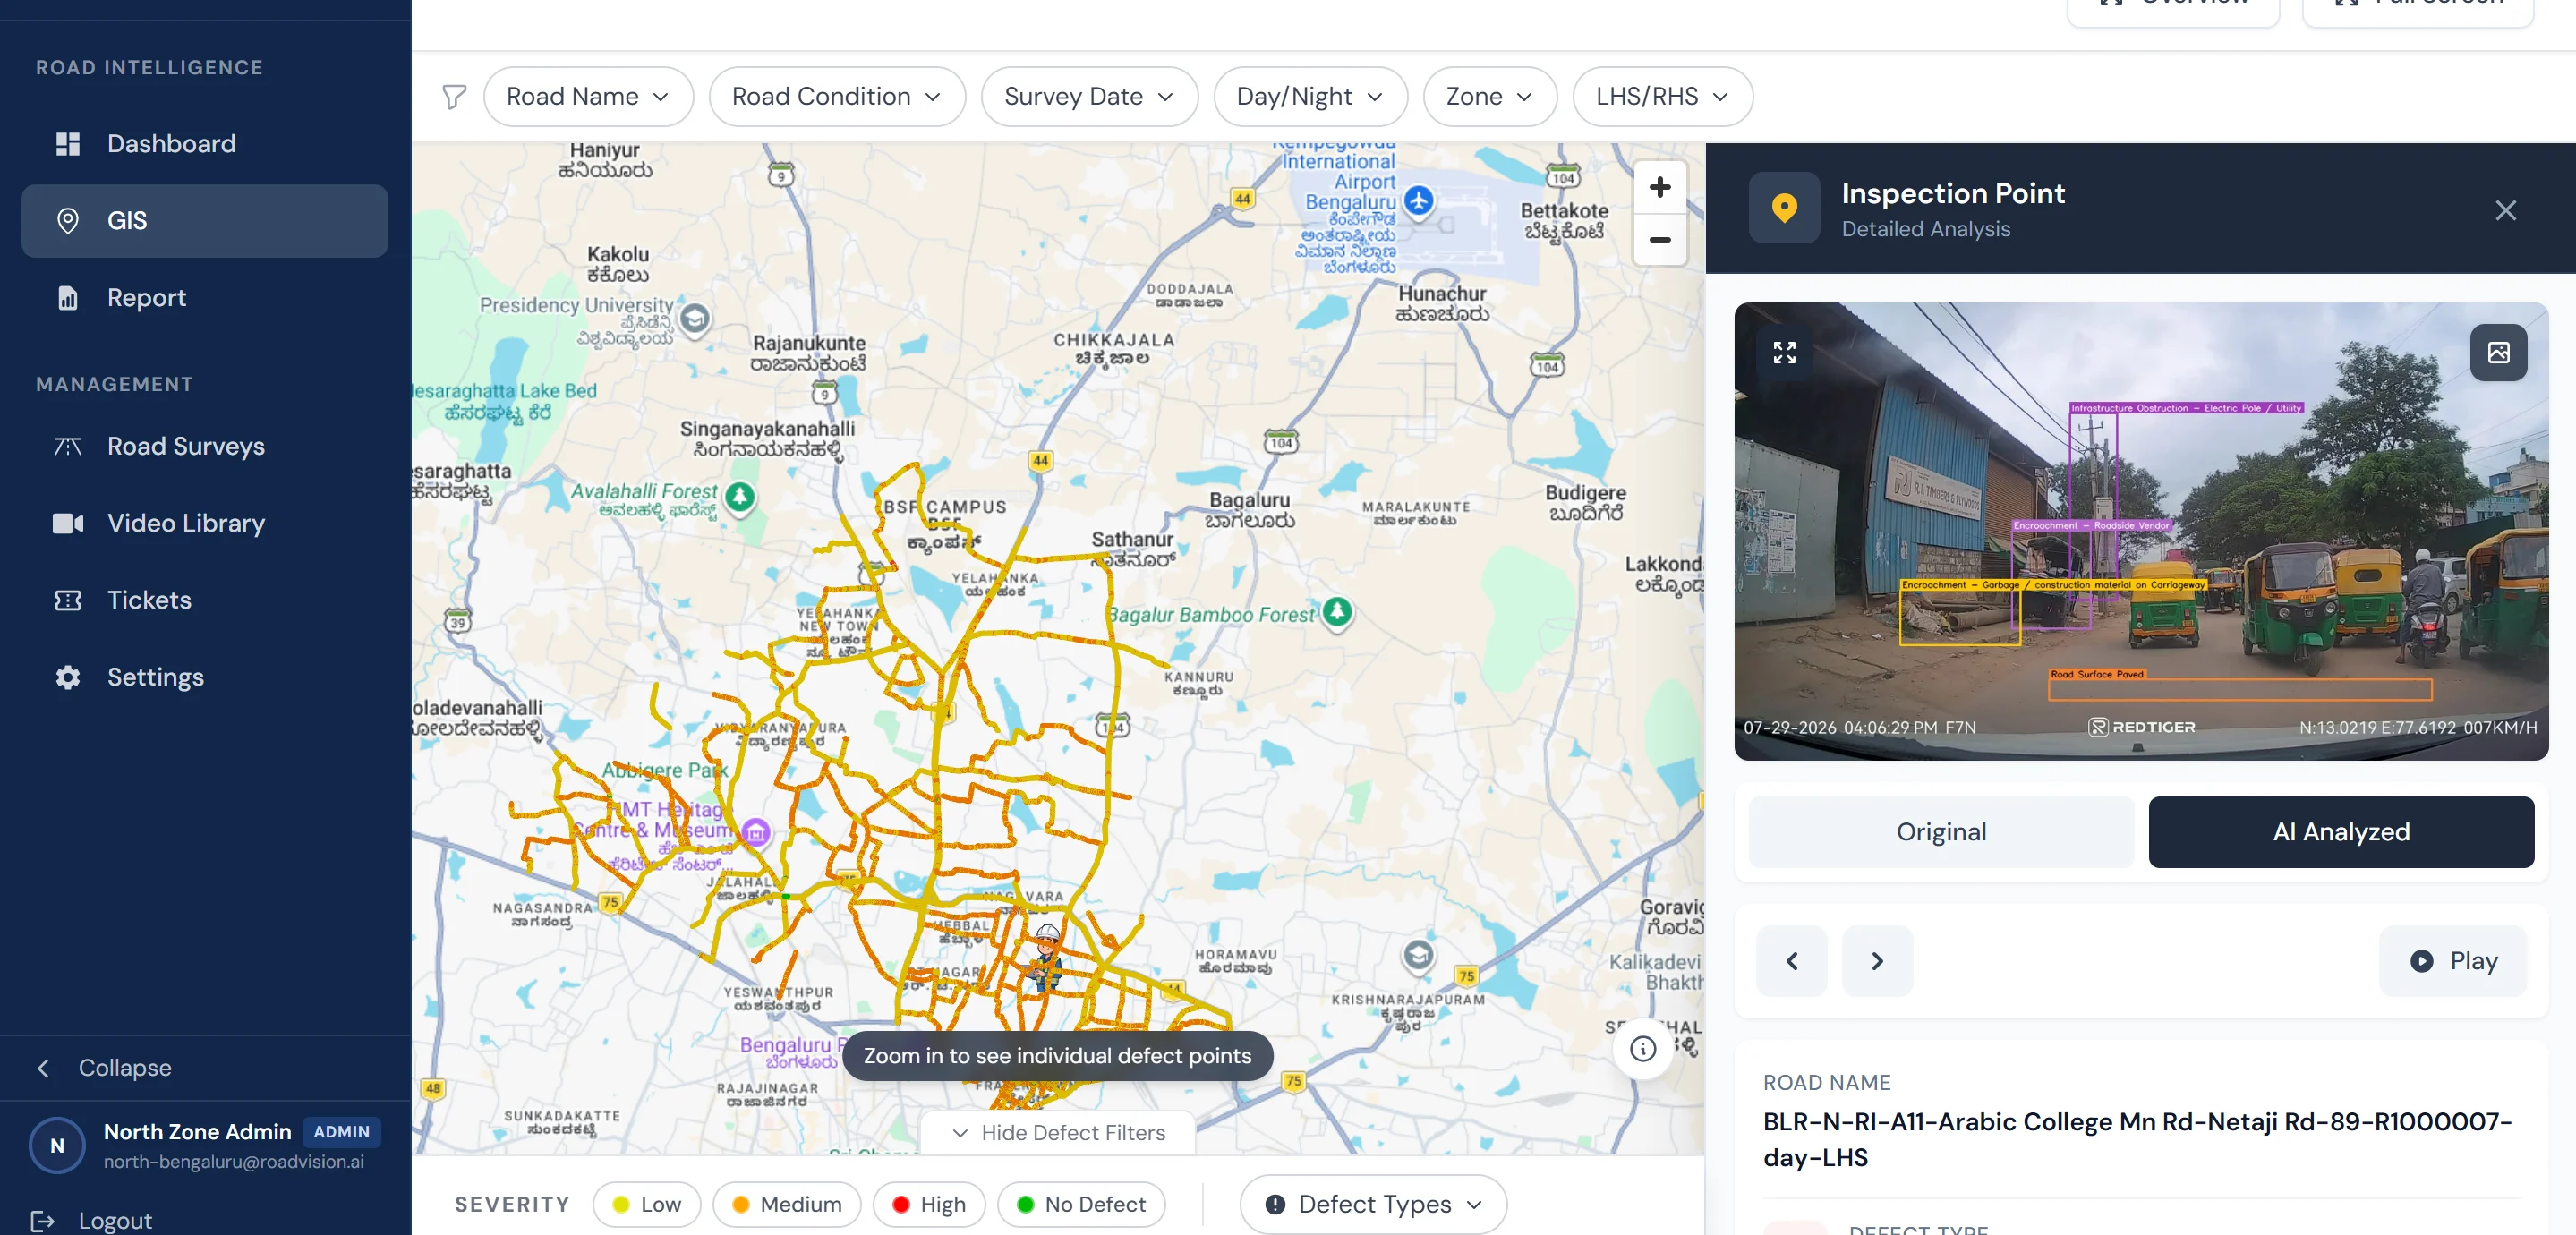
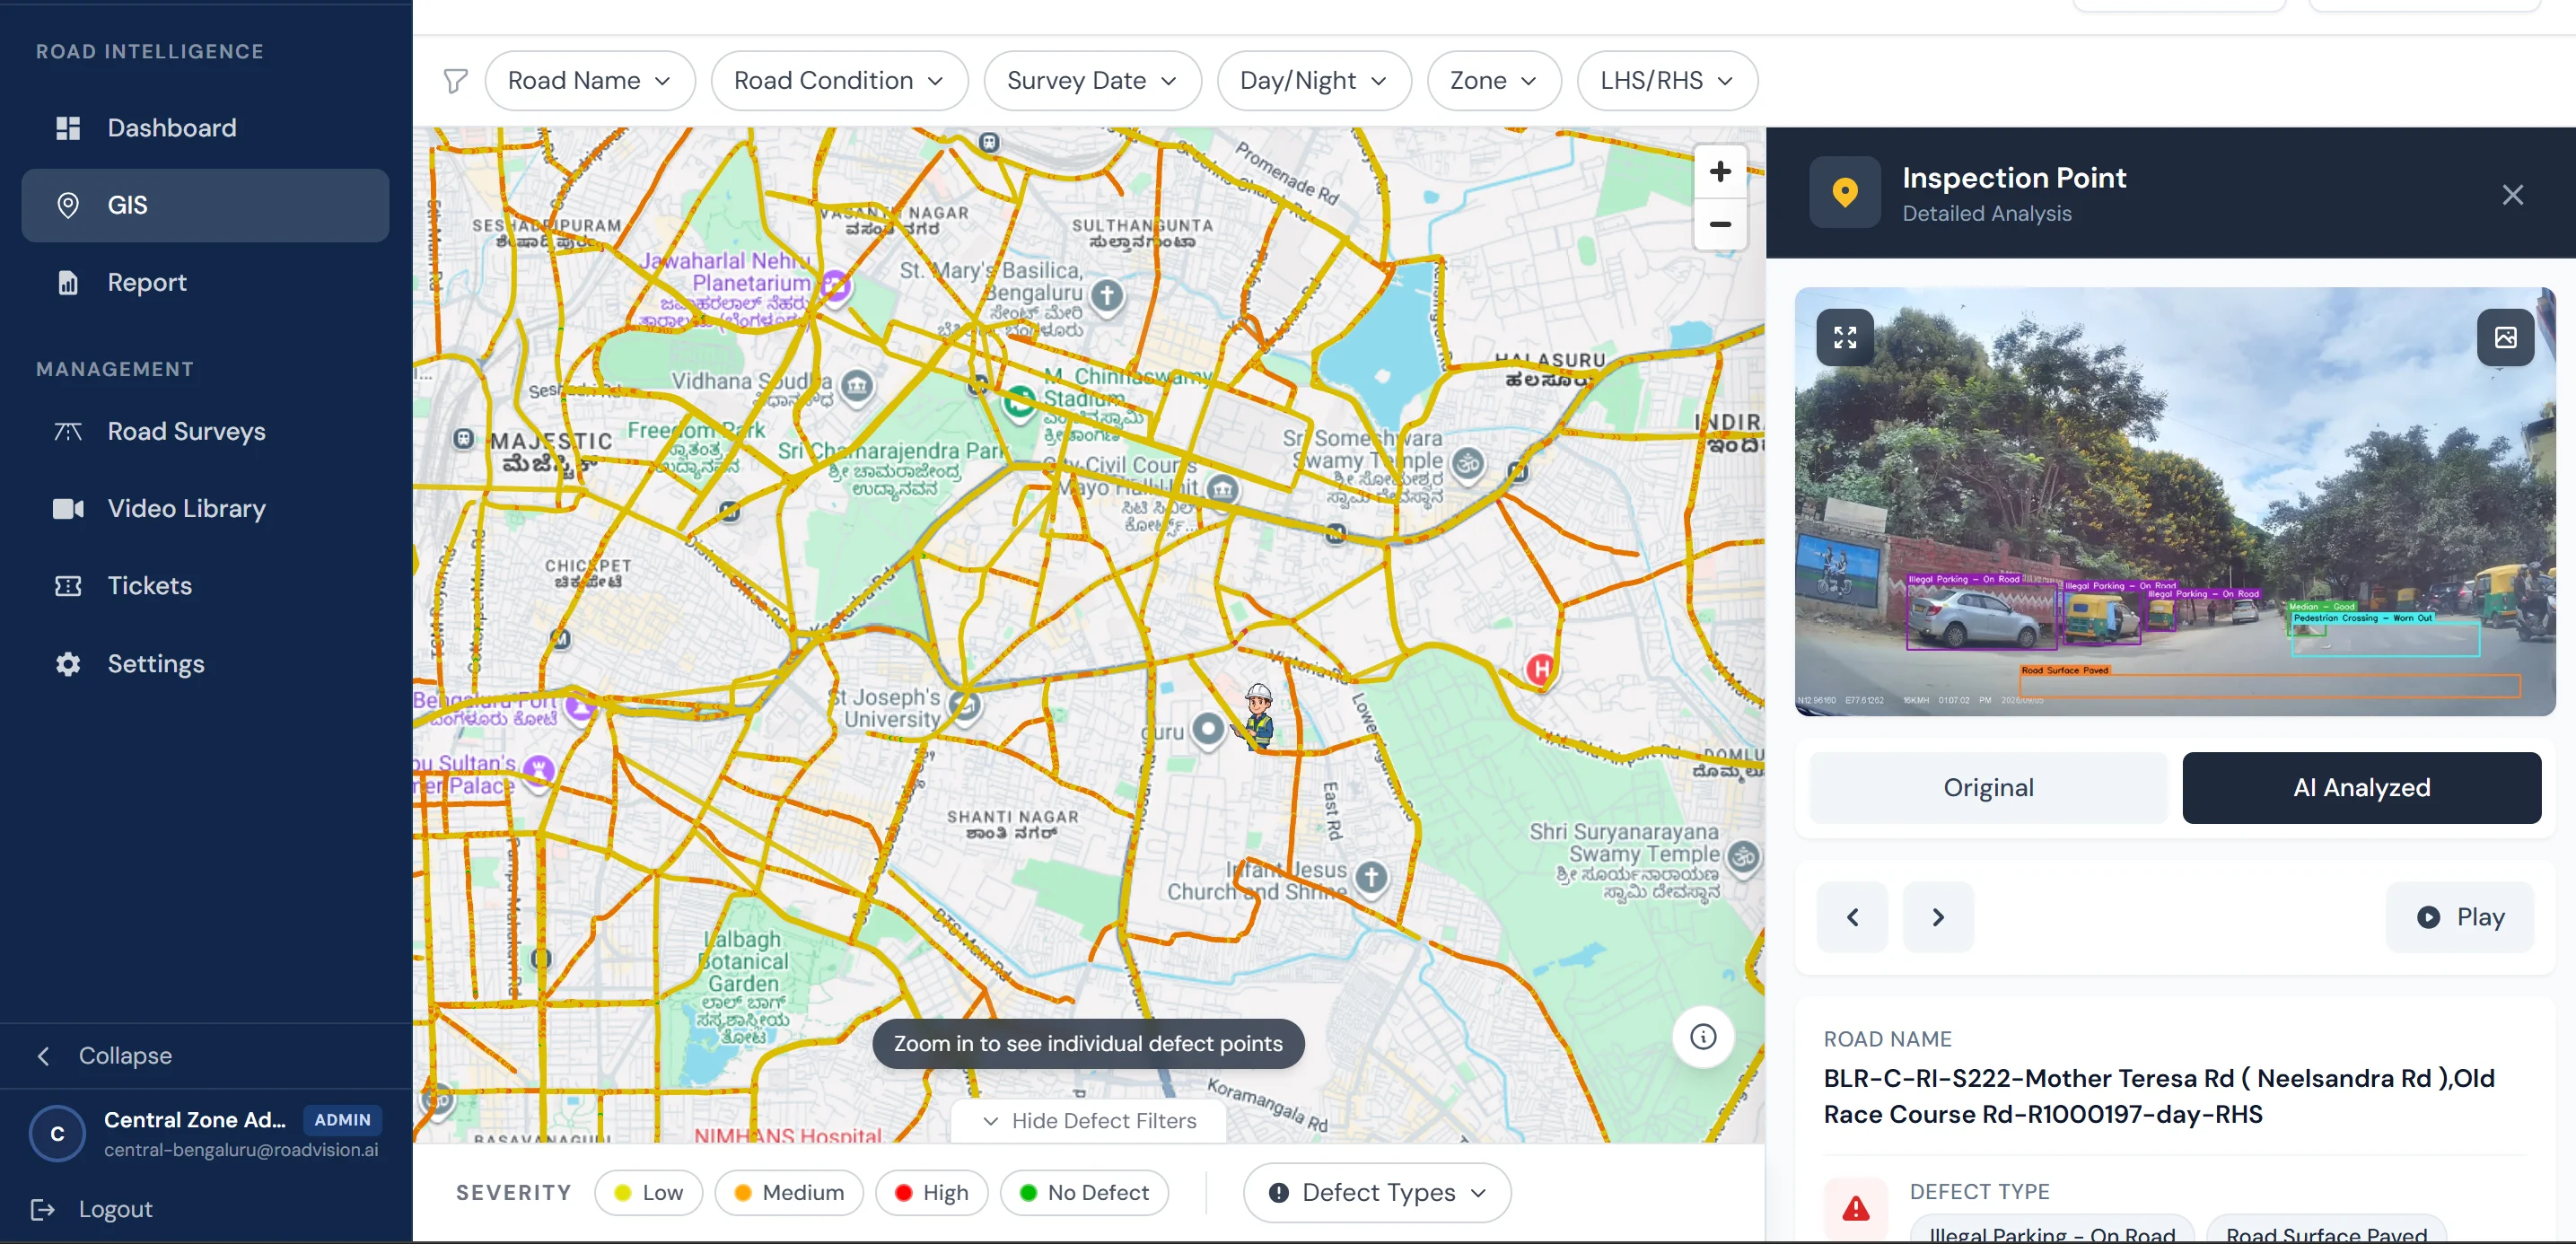
Every finding sits on a live GIS map for its zone, each inspection point opening to its exact location, the defect flagged, and the frame behind it in both original and AI-annotated form. Figure 1 shows the North Zone network around Yelahanka and the airport, with an inspection point flagging roadside encroachment and an obstructing utility pole. Figure 2 shows the Central Zone's dense core around Majestic and Shivajinagar, with an inspection point flagging illegal on-road parking and a worn pedestrian crossing.
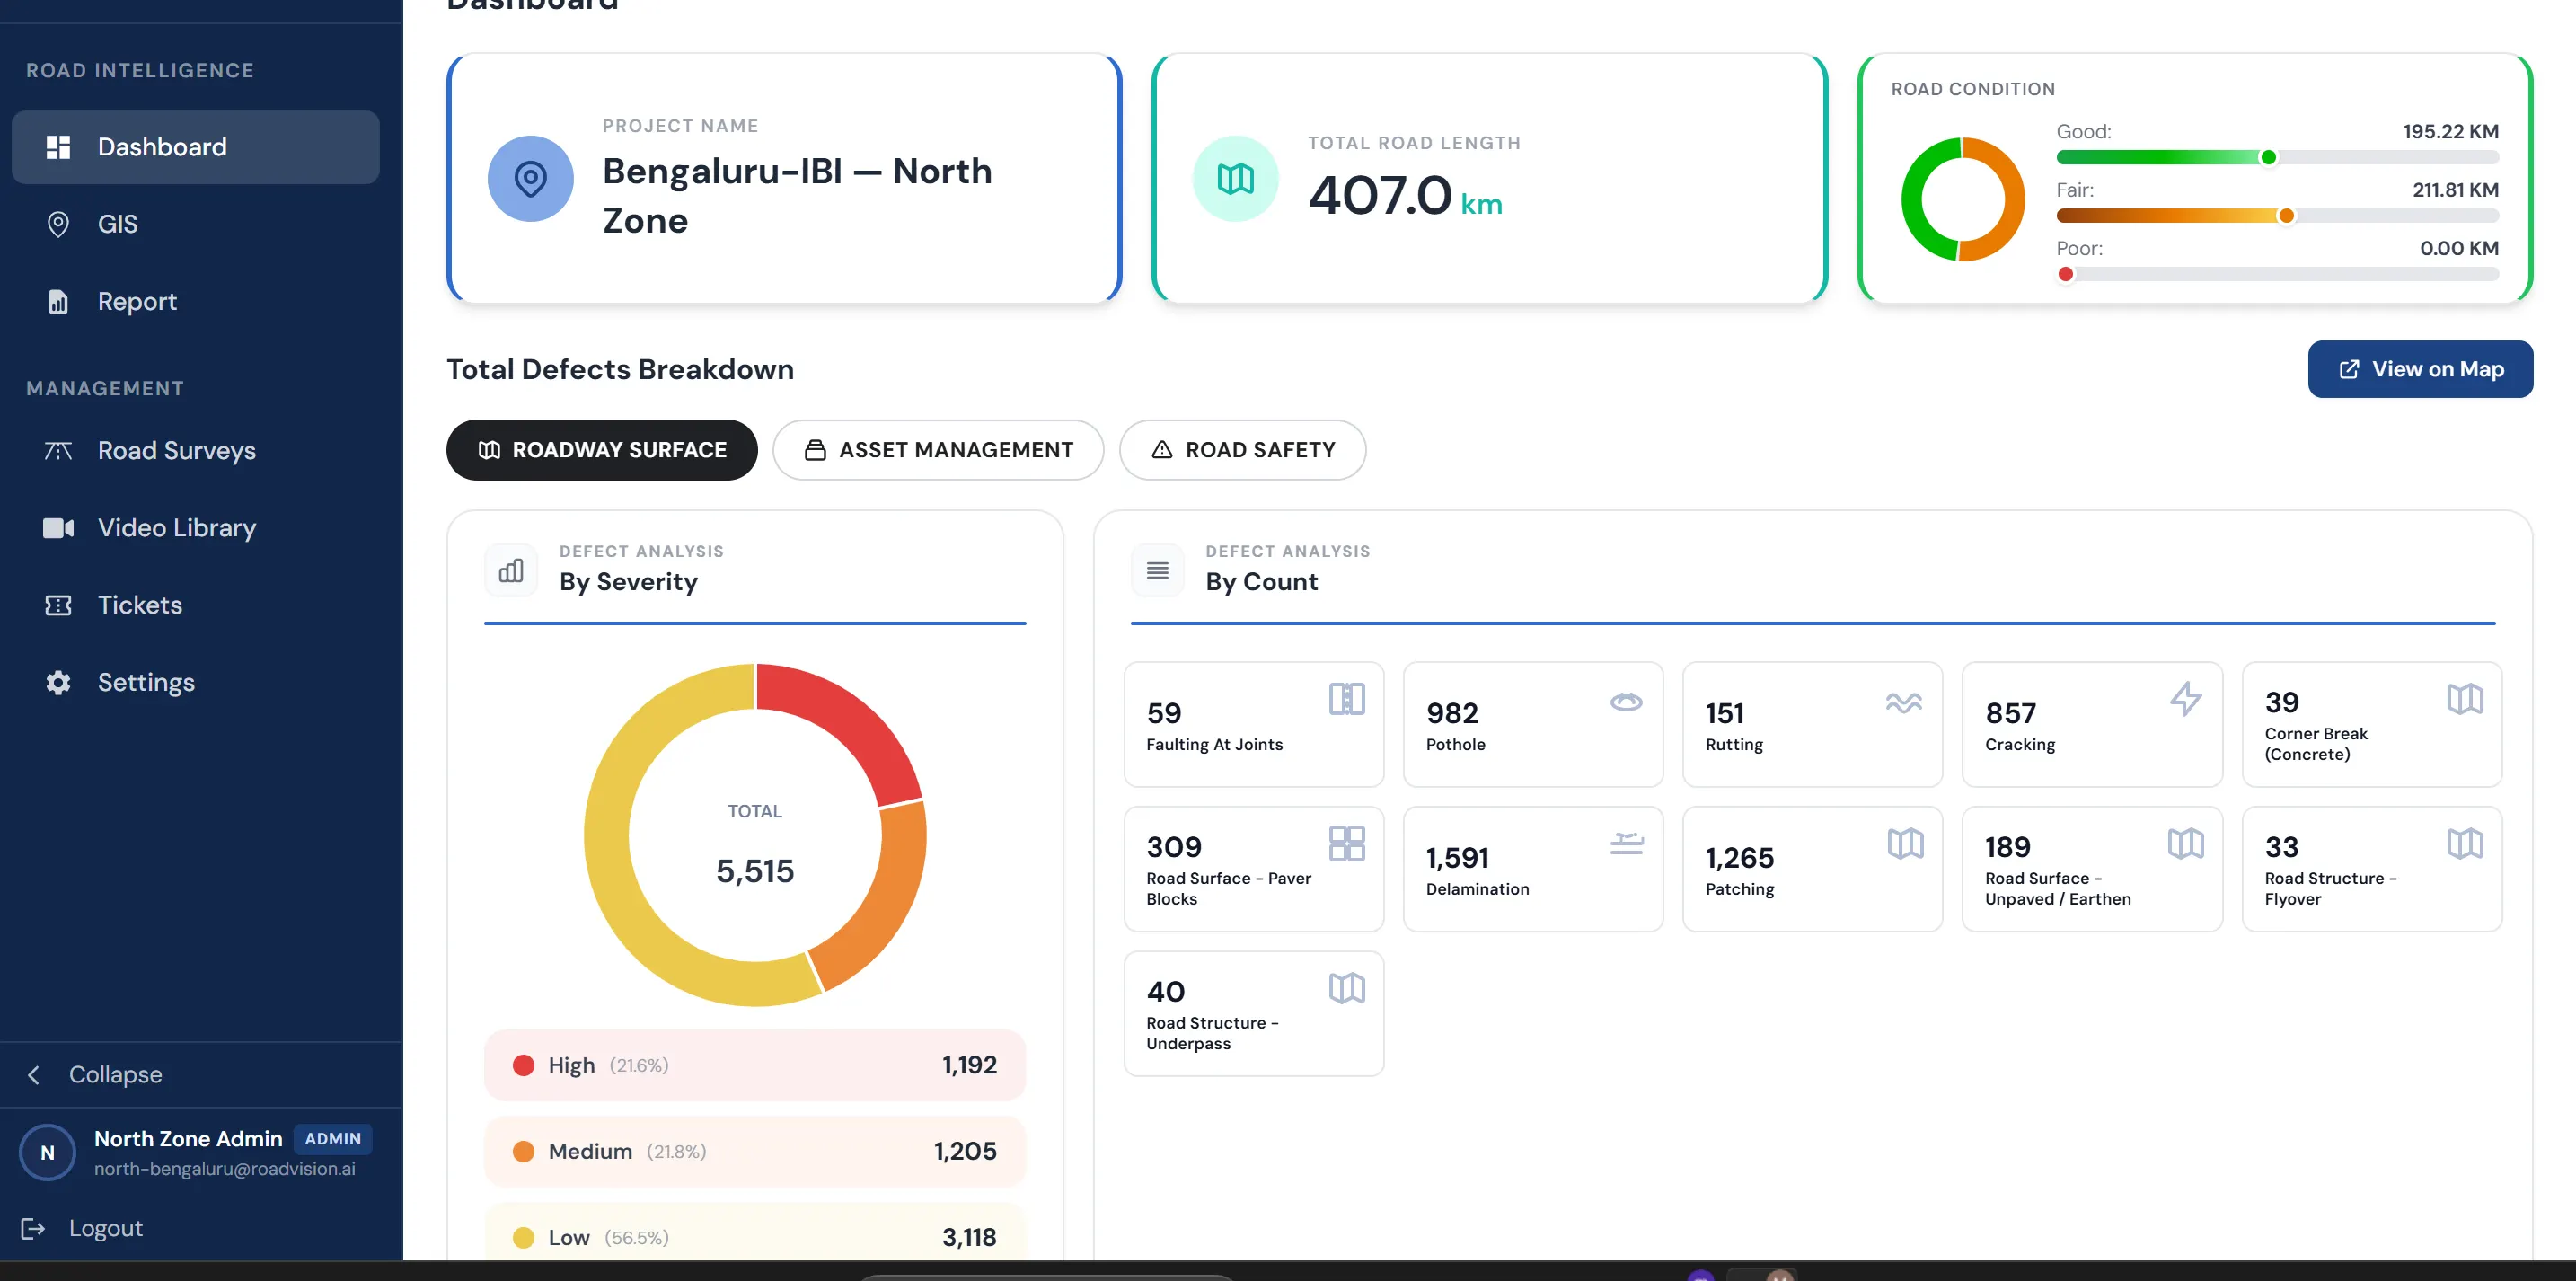
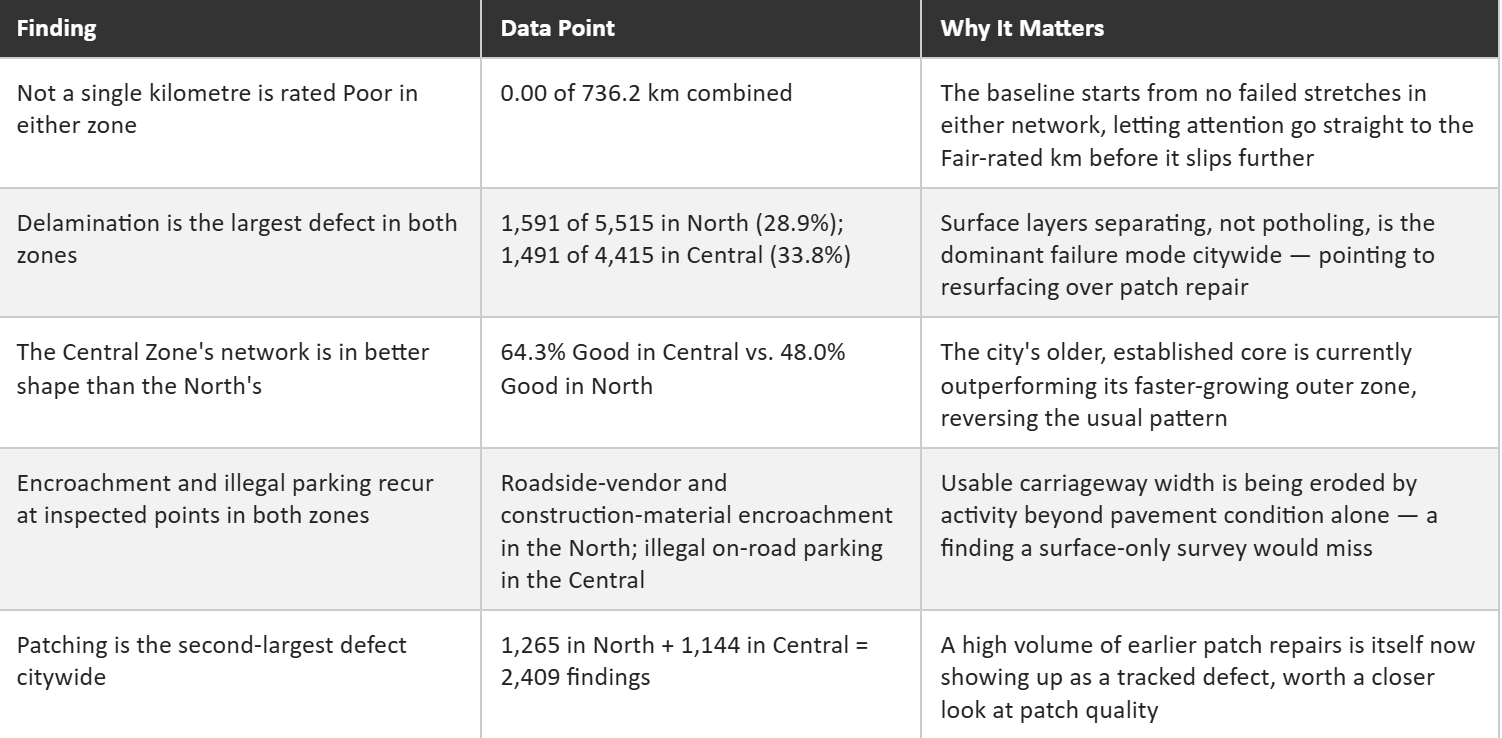
The North Zone's 407.0 km logged 5,515 roadway-surface findings: 1,192 (21.6%) High severity, 1,205 (21.8%) Medium, and 3,118 (56.5%) Low. Surface delamination is the largest single category at 1,591 findings (28.9%), ahead of patching at 1,265 (22.9%), potholes at 982 (17.8%) and cracking at 857 (15.5%). None of the 407.0 km is rated Poor; 195.22 km (48.0%) is Good and 211.81 km (52.0%) Fair.
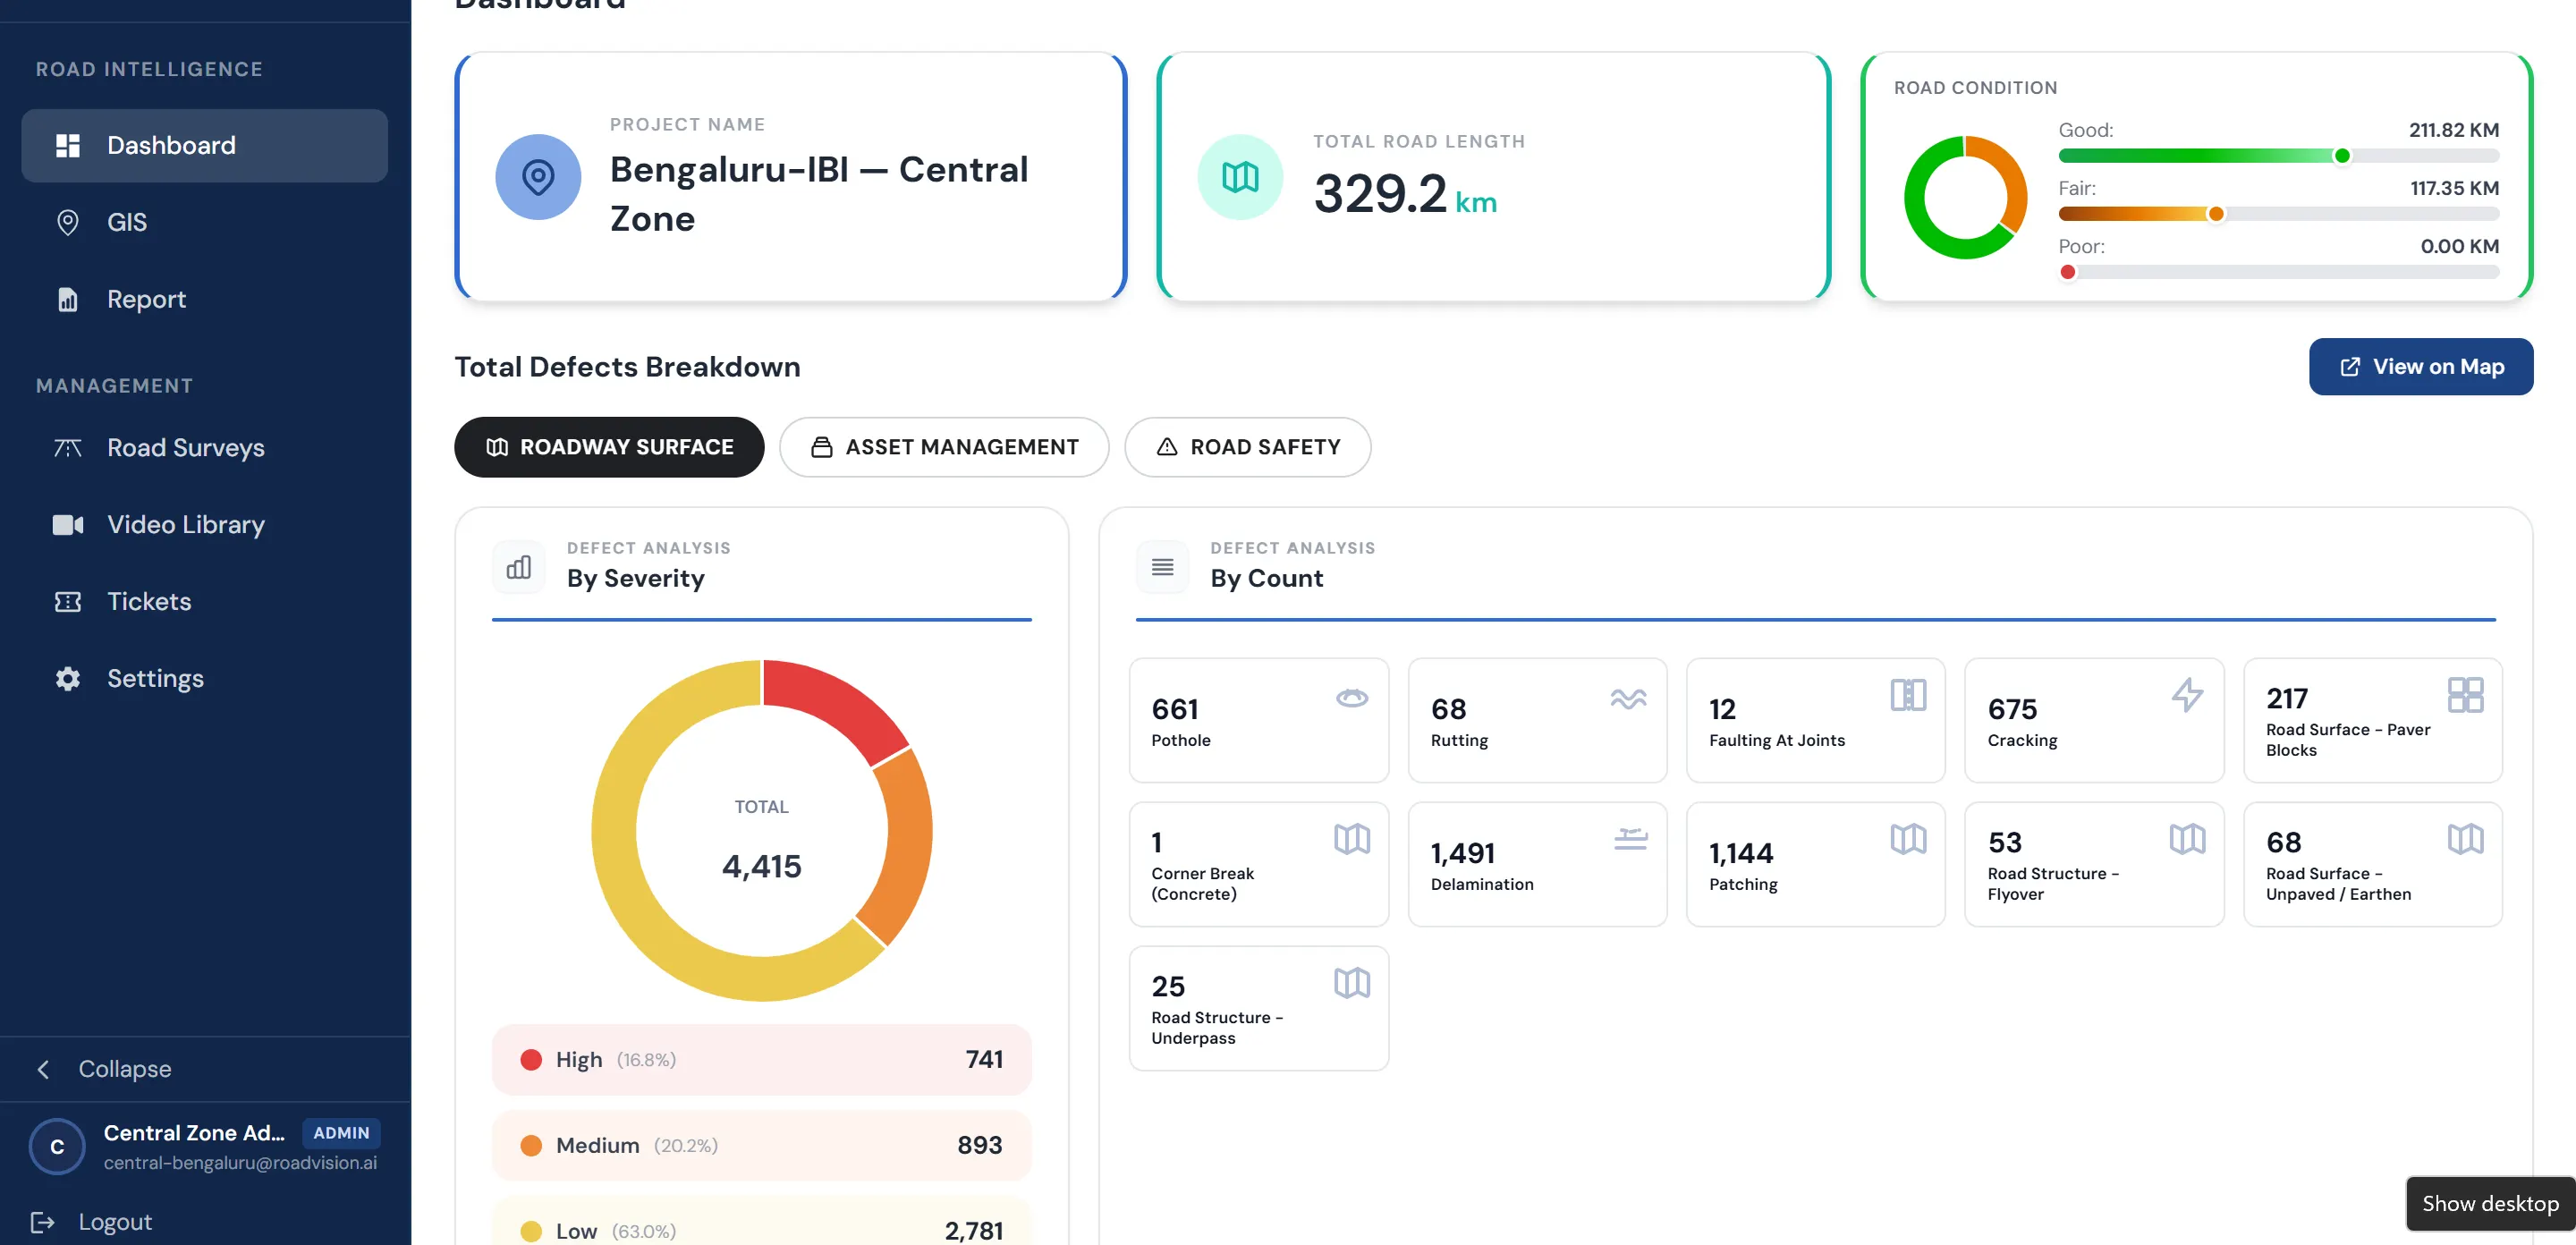
The Central Zone's 329.2 km logged 4,415 roadway-surface findings: 741 (16.8%) High severity, 893 (20.2%) Medium, and 2,781 (63.0%) Low. Delamination again leads at 1,491 findings (33.8%), ahead of patching at 1,144 (25.9%), potholes at 661 (15.0%) and cracking at 675 (15.3%). As in the North Zone, none of the surveyed length is rated Poor; 211.82 km (64.3%) is Good and 117.35 km (35.7%) Fair.
Each zone's findings are organised the way the city's own road engineering teams are organised by zone, by road, by direction so a finding can be handed directly to the division responsible for that stretch rather than requiring translation into a different structure first. Because every defect carries a location, a photograph and a severity grade, re-surveying the same roads on a future cycle will show directly whether a given stretch has improved, held steady, or slipped from Fair toward Poor.
RoadVision AI is committed to extending this kind of zone-wide visibility across Bengaluru's road network, and to giving each zone's engineering teams a shared, comparable record rather than a patchwork of local observations. A city growing as fast as Bengaluru needs to know not just where its roads stand today, but whether the gap between its newer and older networks is closing or widening. That is what consistent, zone-by-zone monitoring is for.

The Autonomous Road Engineer
AI-powered road condition monitoring, asset management, & infrastructure intelligence helping agencies move from reactive maintenance to predictive road management.


.webp)
.webp)
.webp)