
A citywide deployment of RoadVision AI across Vijayawada 859.2 km of the municipal road network surveyed and digitized across 64 wards and 44 major roads, identifying 37,131 defects via dashcam-based AI, and delivered through a full GIS dashboard with a video library, per-ward road reports, and heat-map analytics that support predictive, priority-based maintenance planning.
Vijayawada Municipal Corporation manages one of Andhra Pradesh's largest urban road networks arterial roads, ward-level streets, and connecting links spread across 64 wards and multiple administrative circles. At that scale, VMC's maintenance model, like that of most large Indian municipal corporations, was necessarily reactive: potholes got attention once reported, budget moved toward whichever ward complained loudest, and no single digital record existed of what the network actually looked like at any given time.
The gap was not effort it was visibility at scale. Without a digital inventory, VMC could not compare ward against ward, could not see encroachment or drainage risk building before it became a monsoon-season emergency, and had no way to move from reacting to failures toward predicting where the next failure would occur. The Corporation needed a citywide digitization exercise substantial enough to cover 859.2 km of road across every ward, paired with analytics that could turn a one-time defect count into an ongoing, priority-ranked maintenance plan.
Road records were fragmented across ward offices with no single map of what existed, where it was, or what condition it was in making city-wide comparison or budget planning effectively impossible.
Repairs were triggered by citizen complaints after a road had already failed, rather than by objective condition data that could flag deterioration before it reached that point
A one-time condition snapshot tells you what is broken today. Without a predictive, trend-aware layer, VMC had no way to anticipate where its 859 km network would need intervention next
Illegal parking, unauthorized hoardings, and general encroachment were steadily eating into carriageway width across the city, with no mechanism in place to quantify or act on the scale of the problem
RoadVision AI deployed its AI road condition platform across Vijayawada Municipal Corporation's full jurisdiction surveying 859.2 km of road across 64 wards and 44 major roads, organised by administrative circle so findings could be compared ward against ward, circle against circle, and rolled up to a single citywide view.
VMC and RoadVision AI agreed a full-jurisdiction scope covering 859.2 km across every ward and administrative circle in the Corporation, plus the city's 44 major road corridors, ensuring both neighbourhood streets and arterial routes were captured
Survey vehicles fitted with the RoadVision AI application drove the network at normal traffic speed, with day and night capture supported, logging continuous video and GPS position across every ward a pace of coverage no manual ward-by-ward inspection team could match.
Captured footage was processed through RoadVision AI's computer vision engine across Roadway Surface (potholes, rutting, cracking) and Road Safety (markings, encroachment, drainage, hoardings) domains, yielding 37,131 classified findings at Low, Medium, or High severity
Defect density and severity were translated into a heat-map analytics layer overlaid on the ward and circle structure turning a one-time defect count into a forward-looking view of where deterioration risk is concentrated and where maintenance should be sequenced next.
Full GIS Dashboard, Video Library & Report Delivery LIVE PLATFORM
All outputs were integrated into the RoadVision AI live platform a ward- and circle-filterable GIS dashboard, a continuous video library indexed to every surveyed road, and exportable Comprehensive Road Reports (PDF/CSV) covering all 64 wards and 44 major roads.
The screenshots below show the RoadVision AI platform as deployed for Vijayawada from the citywide dashboard organised by ward and circle, to the road safety analytics that surfaced the network's largest single finding: encroachment at city scale.
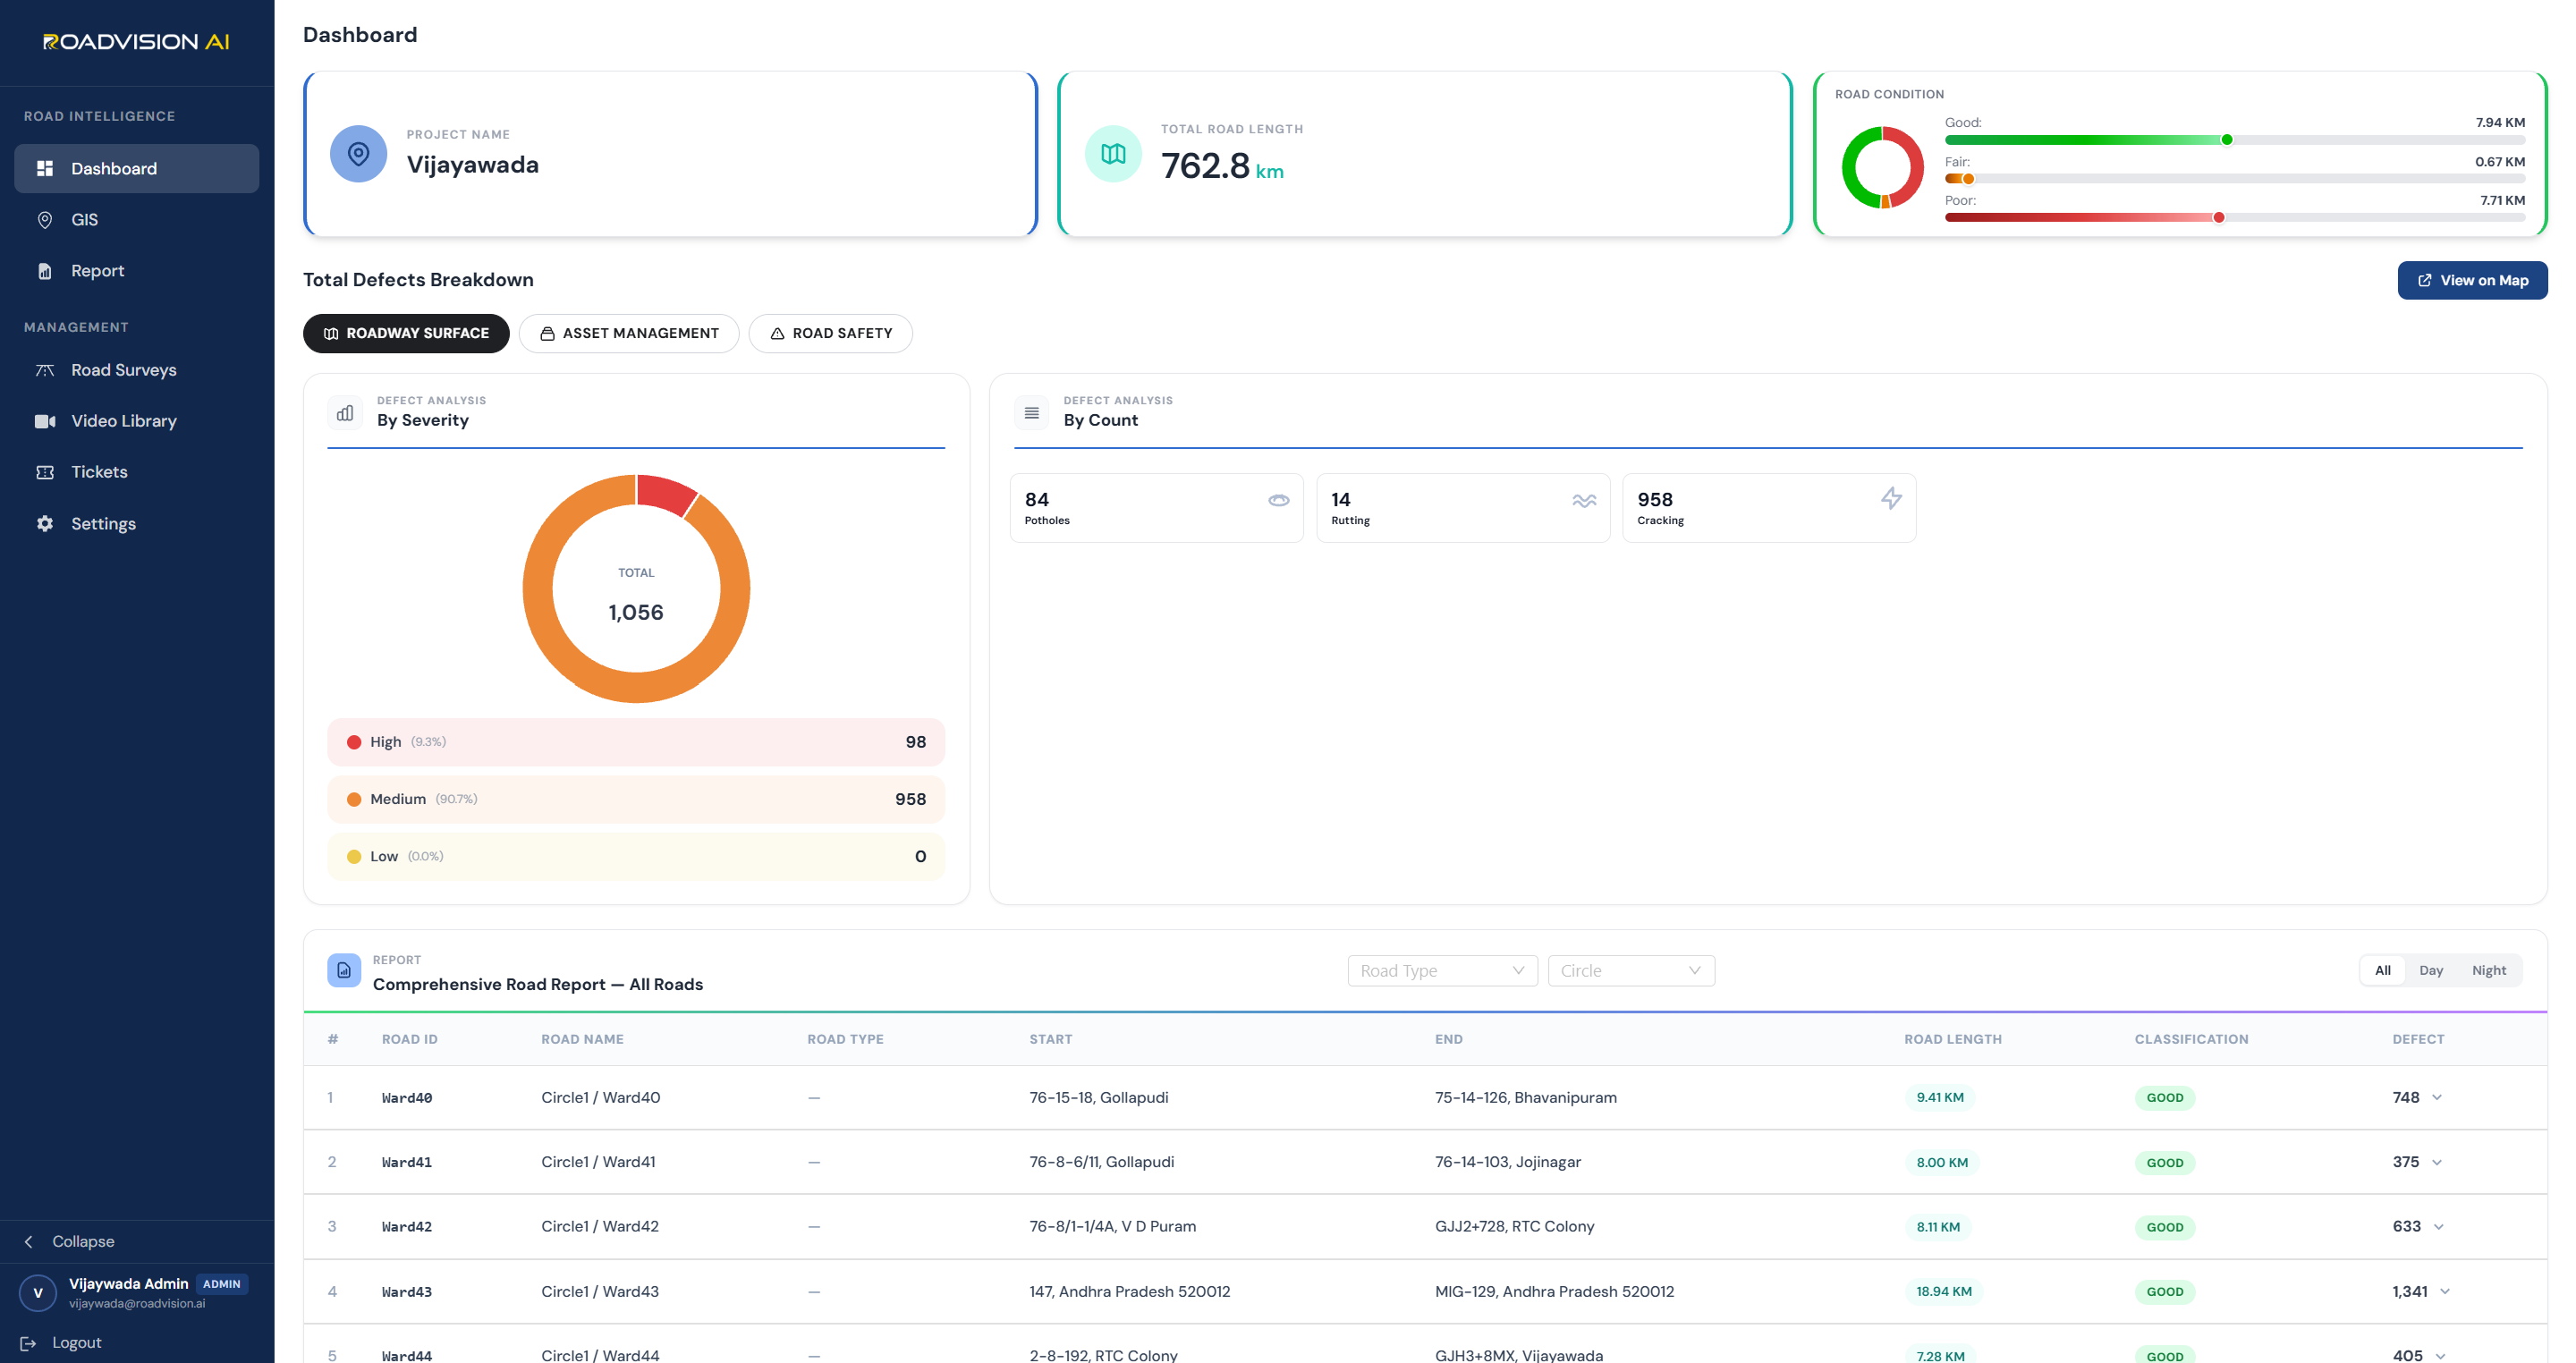
An excerpt of five wards from Vijayawada's 64-ward register, illustrating the level of per-ward detail available across the full city network.

The citywide survey gave Vijayawada Municipal Corporation its first digital, ward-by-ward picture of its 859.2 km network. The findings reshaped what VMC's maintenance priorities should actually be encroachment, not pavement failure, turned out to be the single largest issue on the network by a wide margin.

RoadVision AI's platform delivered five structured outputs from the citywide survey each serving a different VMC user, from the ward officer checking a single road to the Commissioner's office planning next year's maintenance budget.
The command view for engineers and administrators
The visual evidence layer for verification and QA
Documentation for budget submissions and Council review
The layer that turns a snapshot into a maintenance plan
The evidence base behind every finding
The 859.2 km survey did more than produce a defect count it gave VMC a digital foundation it did not have before, and a predictive layer that changes how the Corporation can plan maintenance going forward.
For the first time, VMC has a single, queryable digital record of its entire road network replacing fragmented ward-office paper records with one current source of truth
Heat-map analytics turn a one-time survey into a forward-looking priority layer, letting VMC sequence maintenance by risk rather than waiting for the next complaint.
17,678 encroachment findings and 6,850 unauthorized hoardings give VMC's enforcement teams a precise, GPS-anchored basis for action not an estimate
2,422 missing or damaged drain cover slabs were surfaced ahead of the next monsoon season, giving VMC time to act before flooding turns a maintenance gap into an emergency
For municipal engineers, commissioners, and urban local bodies evaluating AI-powered road digitization and predictive maintenance for large city networks.
RoadVision AI surveyed and digitized 859.2 km of Vijayawada Municipal Corporation's road network, covering all 64 wards and 44 major road corridors. The survey identified 37,131 defects across Roadway Surface and Road Safety domains, and every finding was organised by administrative circle and ward so VMC could compare condition and risk across the whole jurisdiction on a single, consistent basis.
A one-time defect count tells VMC what is broken today. The heat-map analytics layer goes further, mapping defect density and severity across the network to surface where deterioration risk is concentrated turning a static survey into a forward-looking prioritisation tool. Re-run on future survey cycles, the same layer can show whether priority zones are shrinking as maintenance work is completed, moving VMC from reactive repair toward planned, risk-based intervention.
Road Safety findings (36,075) outnumbered Roadway Surface findings (1,056) by roughly 34 to 1 in this survey. The largest single category — general encroachment, at 17,678 instances — reflects how much of Vijayawada's road-condition risk comes from right-of-way loss (illegal parking, vendor encroachment, unauthorized hoardings) rather than pavement failure. This is a structural finding about where a large Indian city's road-quality risk actually concentrates, not a data anomaly.
The video library holds continuous survey footage for every road covered in the 859.2 km survey, indexed for direct navigation without needing to re-drive the network. VMC engineering staff use it to visually verify any AI-flagged defect or safety finding before committing maintenance budget or enforcement action, and it supports day and night capture, extending verification coverage beyond what a daylight-only manual inspection could achieve.

The Autonomous Road Engineer
AI-powered road condition monitoring, asset management, & infrastructure intelligence helping agencies move from reactive maintenance to predictive road management.


.webp)
.webp)
.webp)