This is a project-level account from RoadVision AI's asset and pavement survey programme, covering a motorway route in Ireland surveyed lane by lane. RoadVision AI identified and mapped 1,778 road asset records across nine asset categories, and analysed pavement cracking along the same route. It sets out what was mapped, what the dashboards show, and why a digital inventory tied to chainage and GIS earns its keep in asset management.
Roads are managed asset by asset: a sign that needs replacing, a gully that needs clearing, a barrier that has been struck, a stretch of marking that has worn away. Yet the register that says where these things are, and how many there are, is often incomplete, out of date or held in separate systems. Without a reliable inventory, maintenance tends to be planned from memory and complaints rather than from a record.
This project set out to build that record directly from the road: a digital inventory of assets, mapped in GIS and classified by type, alongside a pavement cracking analysis of the same route, all viewable through the RoadVision dashboard.
A survey vehicle recorded the route lane by lane, with video and GPS. In the dashboards each route is labelled by direction and lane, for example M-road – SB Lane 1, and findings can be filtered by left-hand side (LHS) or right-hand side (RHS). The Network Dashboard reports a total survey length of 292.14 km and a total surveyed lane length of 215.89 km, derived from GPX tracks.
AI then detects assets and defects in the footage. Each detection becomes a record with an ID, GPS coordinates, route and chainage, and defects also carry a measured length and width. A QC control beside each record lets reviewers check a detection against its video frame. Everything is stored against chainage, so the same location can be found again in a later survey.
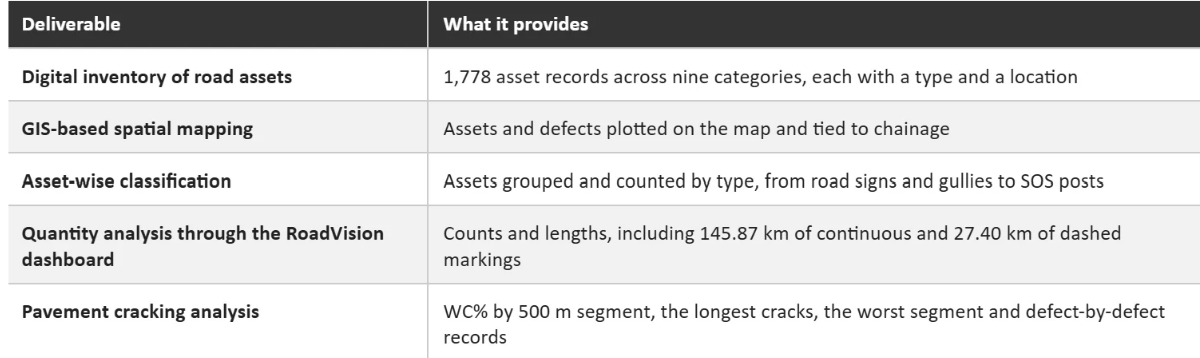
RoadVision AI identified and mapped 1,778 road asset records across nine asset categories, an average asset density of approximately 22 assets per kilometre. Seven categories are itemised below. Together they account for 1,496 records (84.1%), and the remaining 282 records (15.9%) sit in two further categories.
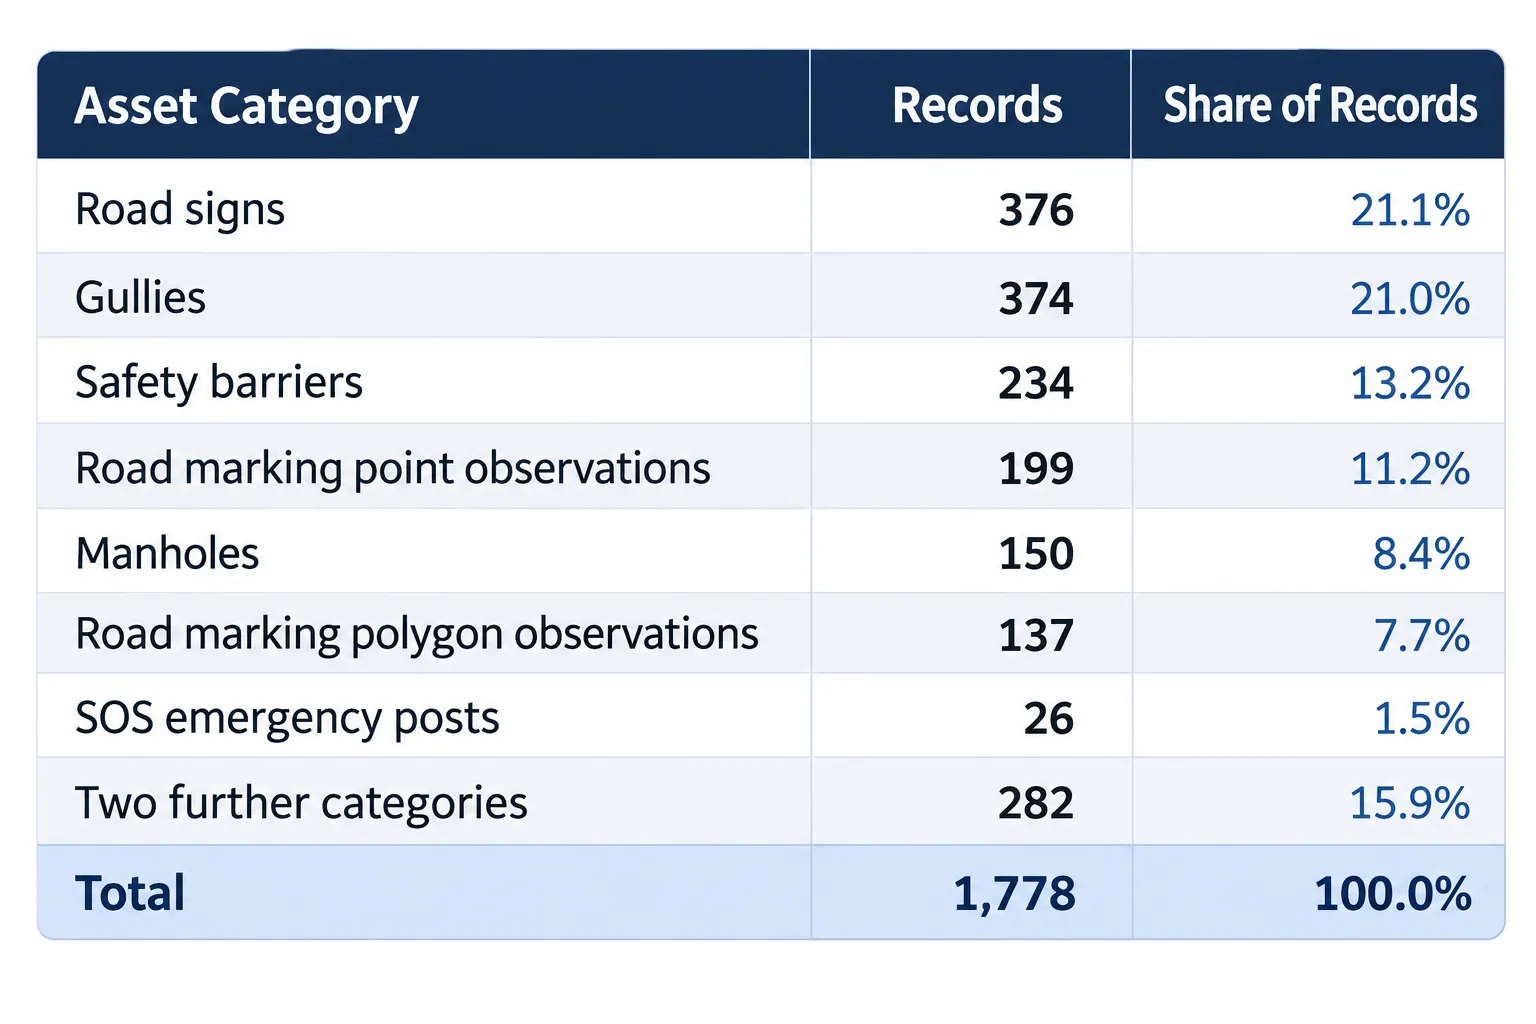
Grouped by function, the largest block is gullies and manholes: together they make up 524 records (29.5%), more than the road signs (376, 21.1%). Road marking observations, point and polygon together, add 336 records (18.9%), and safety assets, barriers and SOS posts, add 260 (14.6%).
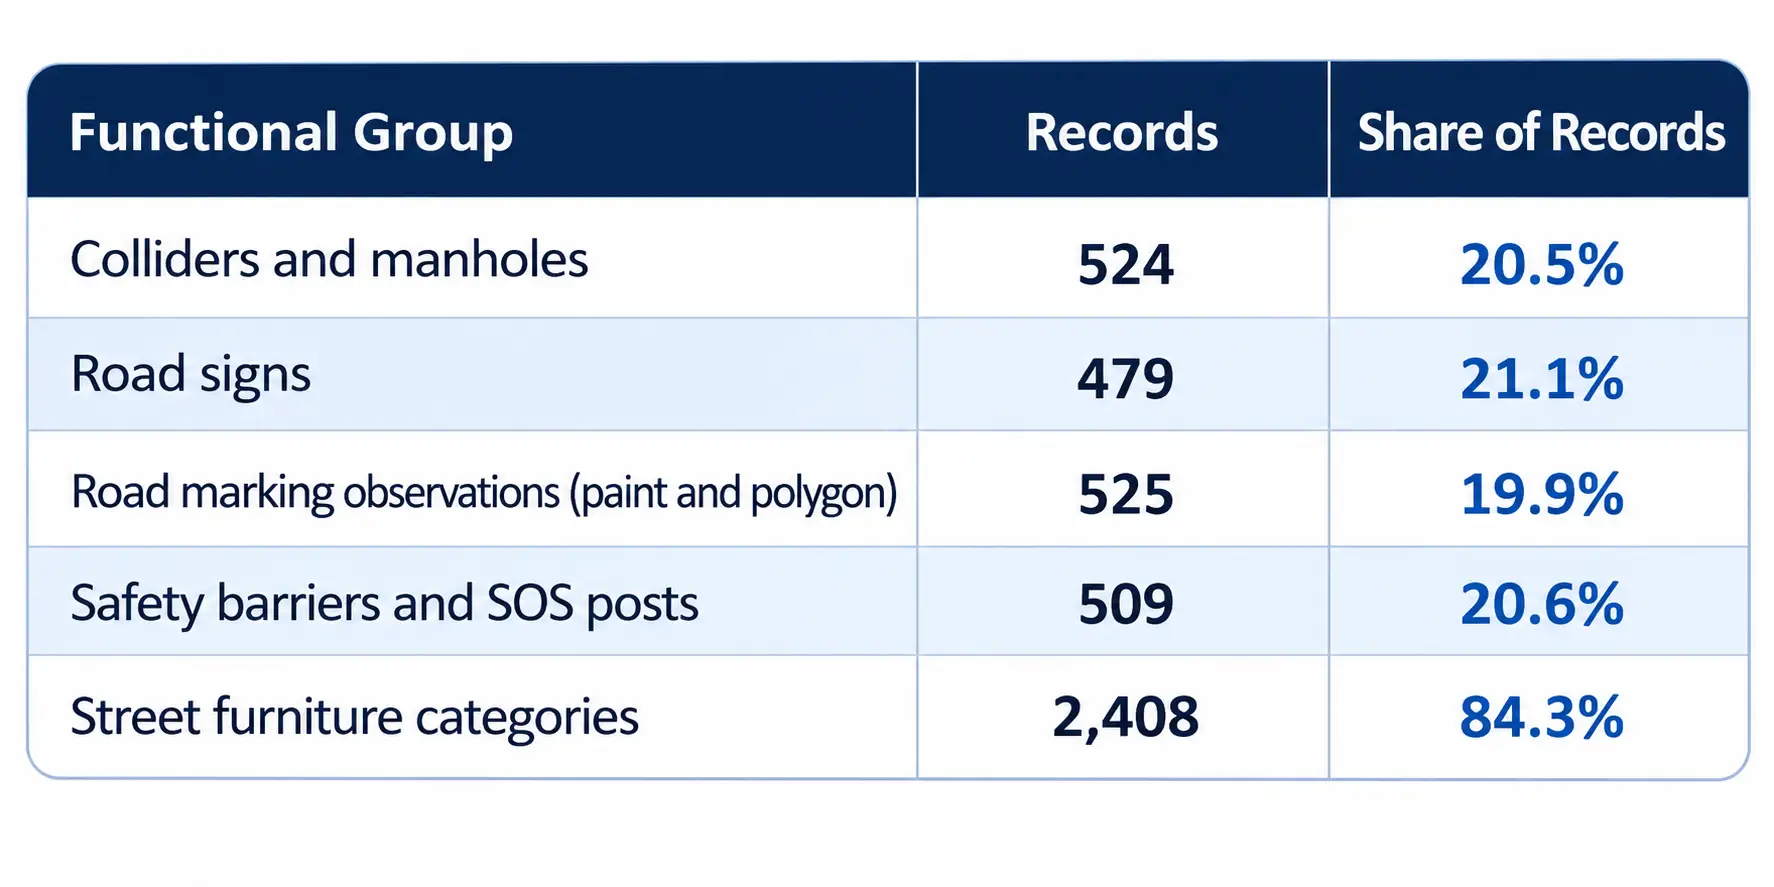
Drainage and access assets matter in a different way from signs or barriers. They are easy to overlook in a desk inventory, they are often partly hidden by dirt or vegetation, and their condition shows up in maintenance cost long before it shows up in a complaint. Having every gully and manhole on a map, with a position and a chainage, makes them plannable.
In addition, the survey captured 145.87 km of continuous road markings and 27.40 km of dashed road markings, 173.27 km in total. Continuous markings are 84.2% of that length and dashed markings 15.8%. Capturing markings as length, not only as observations, gives a quantity that can be used directly when planning renewal.
Alongside the inventory, the Network Dashboard summarises pavement cracking for the whole route, as Figure 1 shows. It reports 2,066 defects and 19,132.3 m of total cracking length over 215,889 m of surveyed lane length. That gives a WC% of 8.86%, the dashboard's cracking measure, calculated as cracking length divided by route length, multiplied by 100.
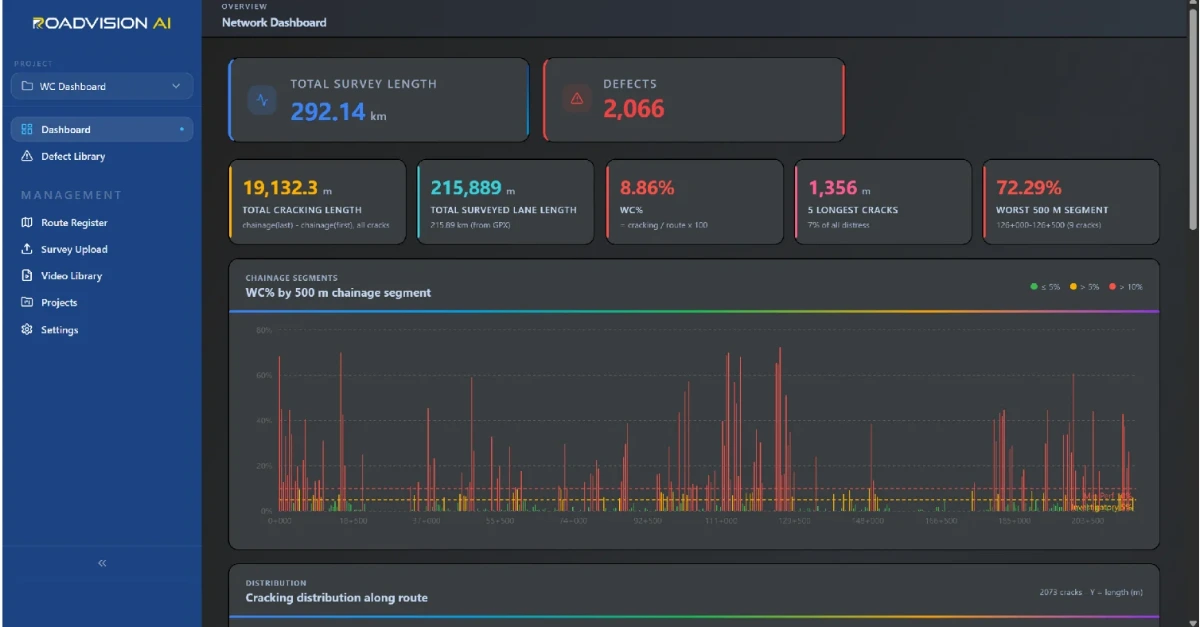
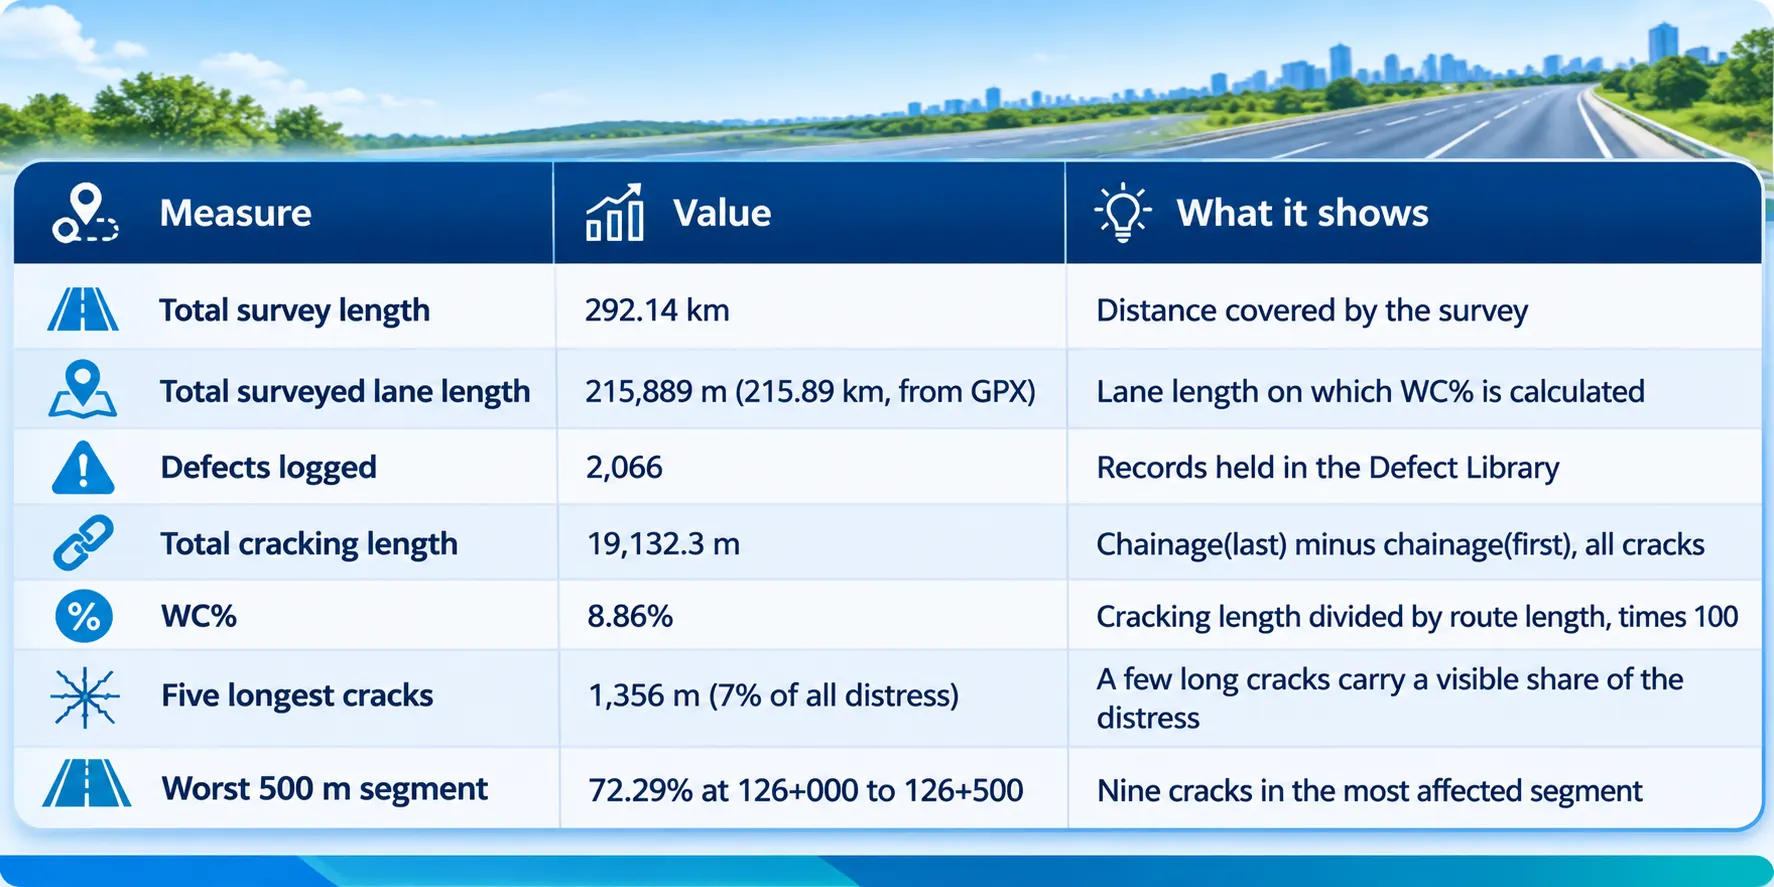
The chart marks two thresholds: an investigatory level of 5% and a minimum performance level of 10%. The route as a whole, at 8.86%, sits above the investigatory level and below the minimum performance level. But an average hides the pattern. The WC% by 500 m chainage segment chart shows many segments in the green band and many in the red, and the worst segment, at chainage 126+000 to 126+500, reaches 72.29%. Clusters of high-WC% segments appear near the start of the route, between roughly 111+000 and 130+000, and from about 185+000 onwards, as read from the chart.
That is the practical value of a segment view. A route-wide number says whether the road as a whole is acceptable. The chainage chart says where to send a crew first.
Every defect behind the dashboard totals can be opened in the Defect Library, shown in Figure 2. The library lists 2,066 defects, filterable by ALL, LHS or RHS, by route and by type. Each record carries a defect ID, type, GPS coordinates, route, chainage, length and width, shown beside a map of the route and the video frame with the lane overlay and the AI detection box.
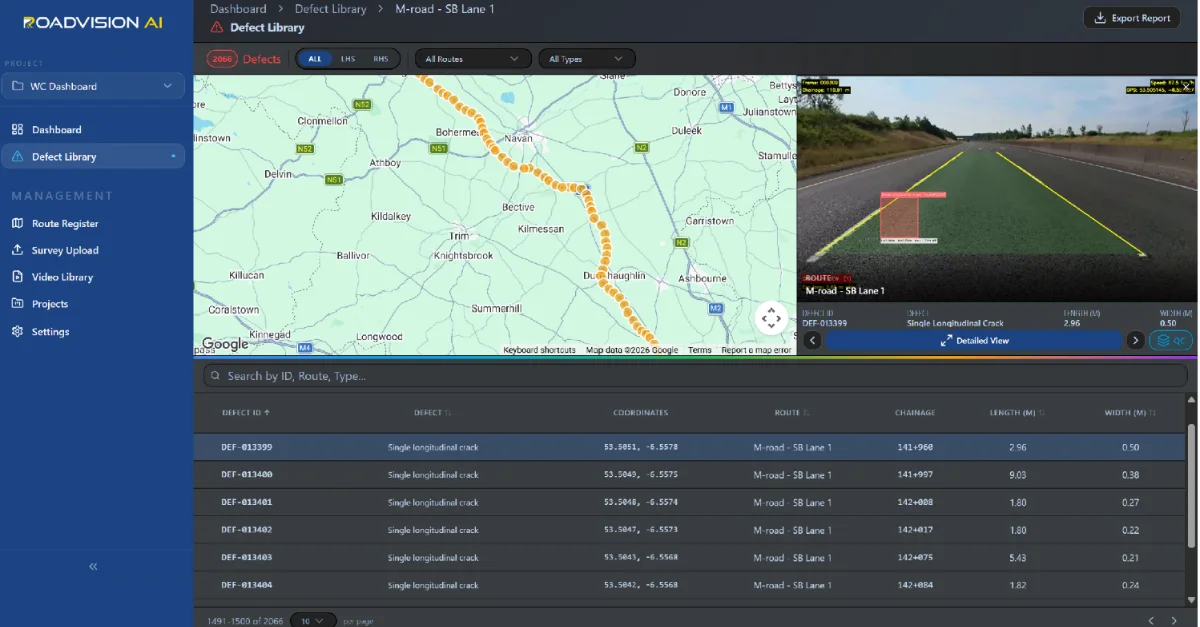
The selected record, DEF-013399, is a single longitudinal crack on M-road – SB Lane 1 at chainage 141+960, 2.96 m long and 0.50 m wide, at coordinates 53.5051, −6.5578. The next five records follow the same pattern.
These six records sit within 124 m of carriageway, from 141+960 to 142+084, and add up to 22.84 m of single longitudinal cracking, with widths between 0.21 m and 0.50 m. A cluster like this is what the segment chart summarises and what a maintenance crew needs to see in detail.
The project deliverables provide a comprehensive digital inventory of road assets, GIS-based spatial mapping, asset-wise classification and quantity analysis through the RoadVision dashboard, supporting road infrastructure monitoring and asset management.
A baseline. A mapped inventory is a starting point. A later survey of the same chainage shows what has been added, replaced, damaged or lost, without anyone having to walk the road again.
Plannable quantities. Counts and lengths turn into work packages: gullies to clear, signs to inspect, barriers to repair, markings to renew. Budgets can be built from quantities instead of estimates.
Targeted maintenance. Segment-level cracking data lets crews start with the worst stretches, not the nearest ones.
One drive, two answers. The asset inventory and the pavement condition come from the same survey, so they share chainage and GIS. A cracked stretch and the gullies beside it can be read together.
A digital inventory is only as useful as the care taken in producing it. Four points shape how the figures in this case study should be read.
Length bases. Survey length (292.14 km) and surveyed lane length (215.89 km) are different bases, so every metric needs to state which one it uses. WC% is calculated on lane length.
Observations and lengths. Road markings are recorded in more than one way: as point observations, as polygon observations and as lengths of continuous and dashed line. Counts of observations and kilometres of marking measure different things and should not be added together.
Review. AI detections carry a QC step, in which reviewers check a detection against its video frame before totals are relied on.
Positioning. Coordinates and chainage depend on GPS quality. Tree cover, bridges and cuttings can degrade it, so positions are checked against the map.
Each survey gives the road owner an asset or defect ID, a position and a chainage for every record, independent of the agency doing the work. A later survey of the same chainage then shows whether a finding has been closed out, so that verification does not rest on the maintaining agency's own account.
RoadVision AI is committed to keeping this asset inventory and cracking record current, survey after survey, giving the road owner a consistent, chainage-level record of what the road holds and how it is performing. That is how an asset register stops being a snapshot and becomes a tool for managing the road.

The Autonomous Road Engineer
AI-powered road condition monitoring, asset management, & infrastructure intelligence helping agencies move from reactive maintenance to predictive road management.