
A 131 km AI-powered road safety audit of the NH7 highway corridor through Devprayag, Tehri Garhwal, and Pauri Garhwal, Uttarakhand using vehicle-mounted dashcam surveys and AI-based analysis to detect and classify pavement and safety-relevant defects by severity, track condition directionally by carriageway (LHS/RHS), and map every finding to a precise chainage and GPS location. Delivered through a GIS dashboard giving the road authority location-specific, actionable insight across one of Uttarakhand's most demanding hill highway corridors.
The Rudraprayag Highway corridor runs along NH7 through Devprayag and into the Tehri Garhwal and Pauri Garhwal districts of Uttarakhand a stretch of Himalayan hill highway defined by hairpin bends, cliff-edge carriageways, and sections running directly alongside the river gorge below. It is precisely the kind of corridor where road safety matters most and where a traditional safety audit is hardest to run: narrow carriageways with few safe stopping points, terrain prone to rockfall and monsoon erosion, and long stretches where an inspection team on foot is itself exposed to real risk.
The road authority needed a way to assess the corridor's safety condition pavement distress, debris hazards, marking visibility, and directional risk without mobilising a full walking or slow-moving inspection team along 131 km of hill road. The survey needed to capture not just whether a section was defective, but which side of the carriageway, at what chainage, and against which specific hazard type, so the results could translate directly into a prioritised improvement plan
Narrow hairpin carriageways, limited safe stopping points, and rockfall-prone terrain make a traditional walking or slow-vehicle safety audit genuinely hazardous to run over 131 km of hill highway
Hill highways face a distinct failure mode moisture ingress, shoulder erosion, and heavy vehicle loading on steep gradients that a generic plains-road survey taxonomy is not built to track
Rockfall and landslide debris intruding onto the carriageway is a safety-critical hazard specific to Himalayan corridors, with no continuous monitoring mechanism between scheduled inspections.
On a cliff-and-valley route, one carriageway direction may run against a hillside and the other along a drop-off meaning a single combined road rating cannot capture the real, directional risk profile
RoadVision AI surveyed the full 131.3 km Rudraprayag Highway corridor using a vehicle-mounted dashcam rig, processing the footage through its AI engine to detect pavement and safety-relevant defects, classify each by severity, and track condition separately by carriageway direction across the hill terrain.
The survey scope covered the full Rudraprayag Highway corridor along NH7, running through Devprayag and across the Tehri Garhwal and Pauri Garhwal districts a representative, high-risk hill highway profile.
A dashcam-equipped survey vehicle drove the corridor at normal traffic speed, capturing continuous video, GPS position, chainage, and vehicle speed for every frame without requiring an inspection team to stop or walk any section of the hill road.
Footage was processed through RoadVision AI's computer vision engine to detect pavement, shoulder, and safety-relevant defects including debris, faded markings, and monsoon-driven erosion with every finding classified by severity and geo-tagged to its precise chainage
Findings were tracked separately by carriageway side (LHS/RHS), reflecting the asymmetric risk profile of a hill corridor where one direction may run against a rock face and the other along a river gorge or drop-off
All findings were delivered through a GIS dashboard filterable by Road Name, Authority, Road Type, Road Condition, Survey Date, Day/Night, and LHS/RHS giving the road authority location-specific, actionable insight to support safety assessment and improvement planning.
The screenshots below show the RoadVision AI platform as deployed for the Rudraprayag Highway corridor from the dashboard summarising condition and defect severity across the full 131 km stretch, to the GIS map pinpointing a specific hazard down to its chainage and GPS coordinate on a genuinely difficult stretch of hill terrain.
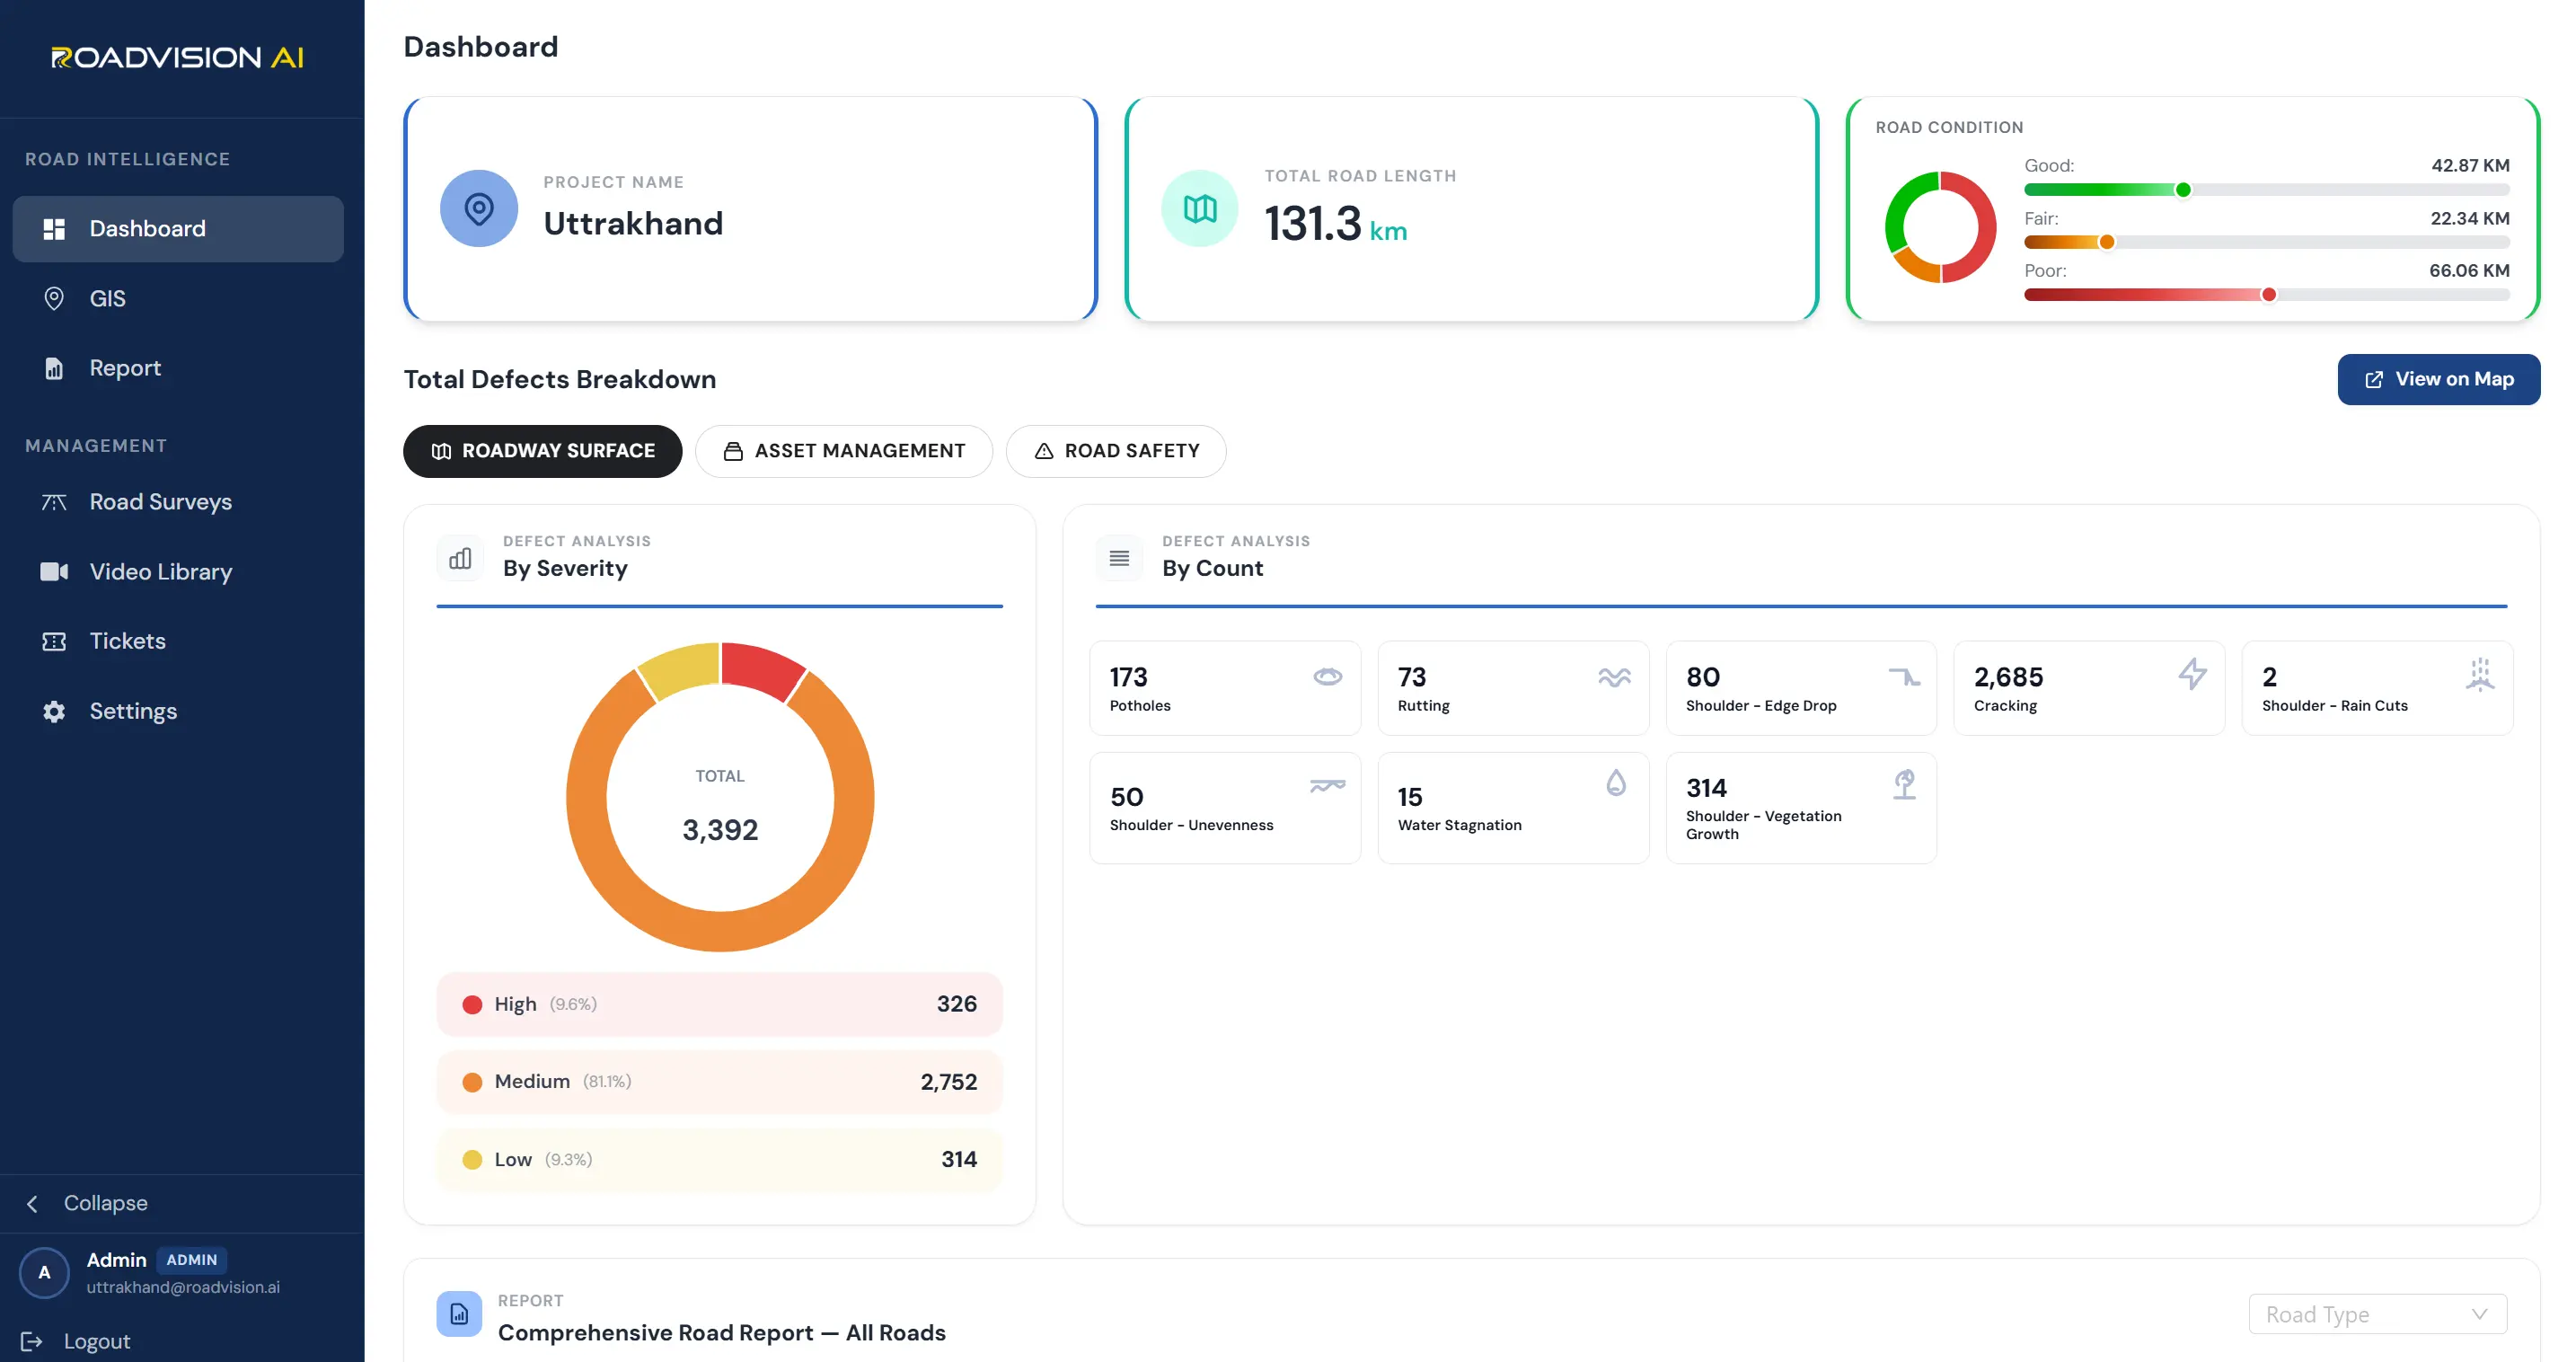
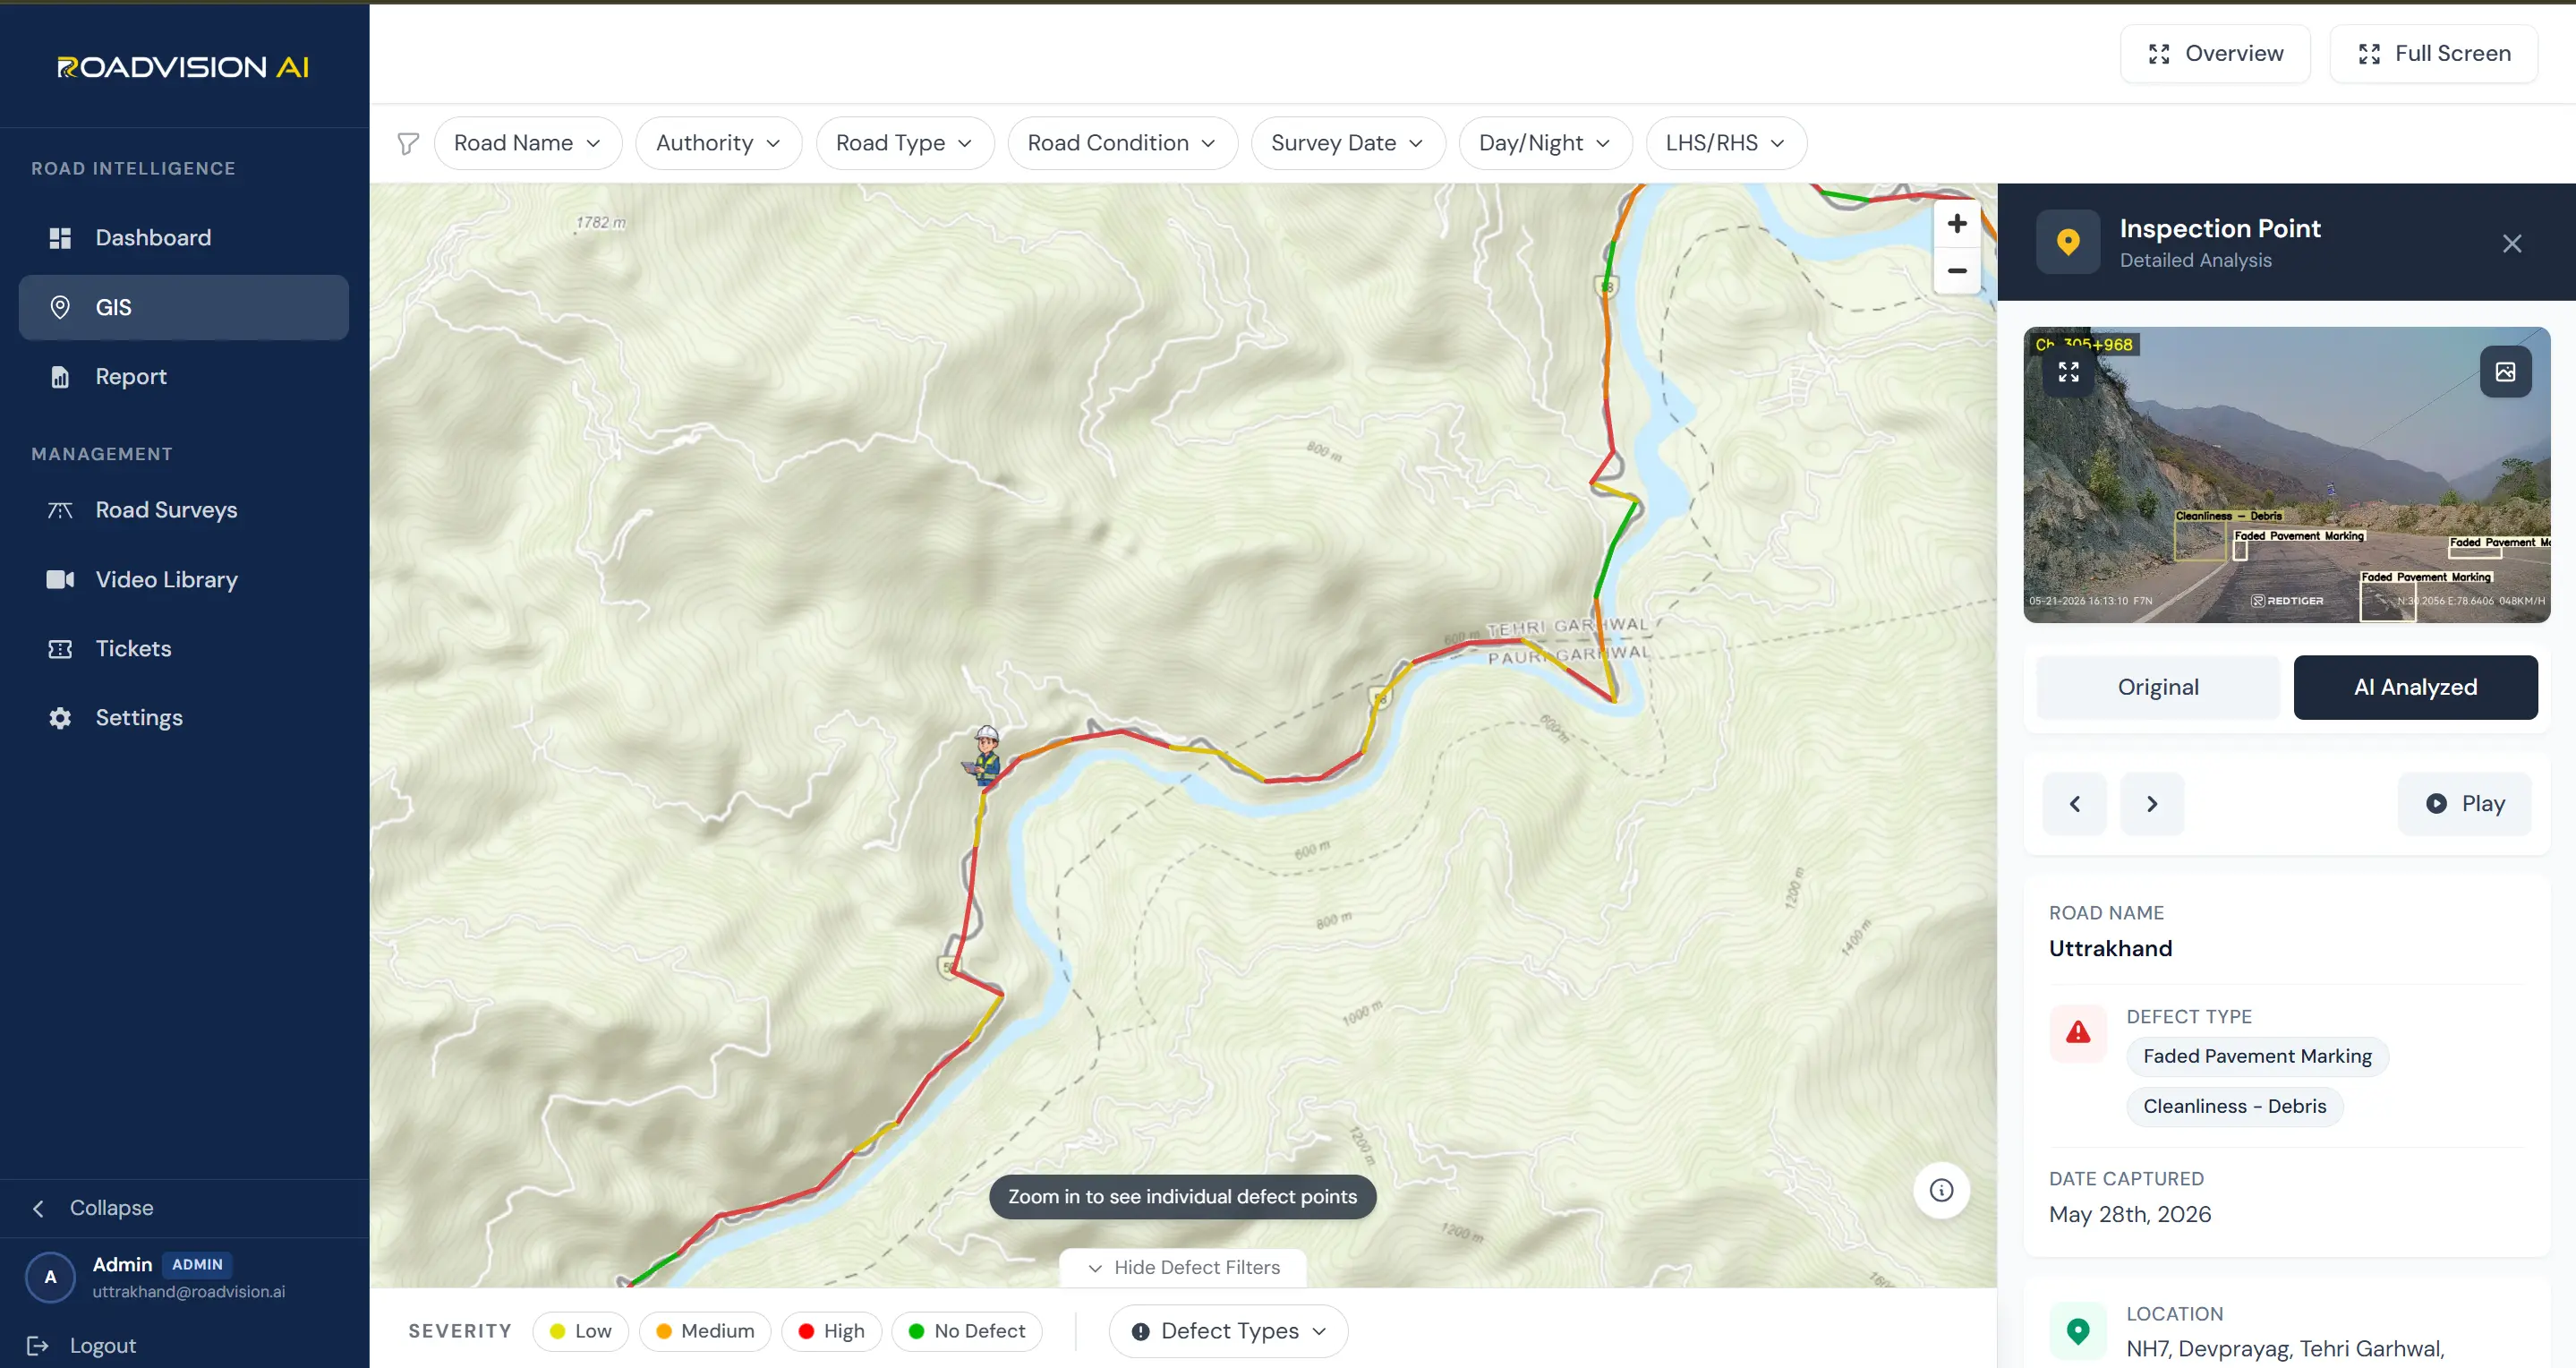
The survey gave the road authority its first chainage-level, directionally aware safety picture of the Rudraprayag Highway corridor. The condition profile is markedly worse than a typical plains or urban corridor consistent with the demands hill terrain and monsoon exposure place on a highway like this one.
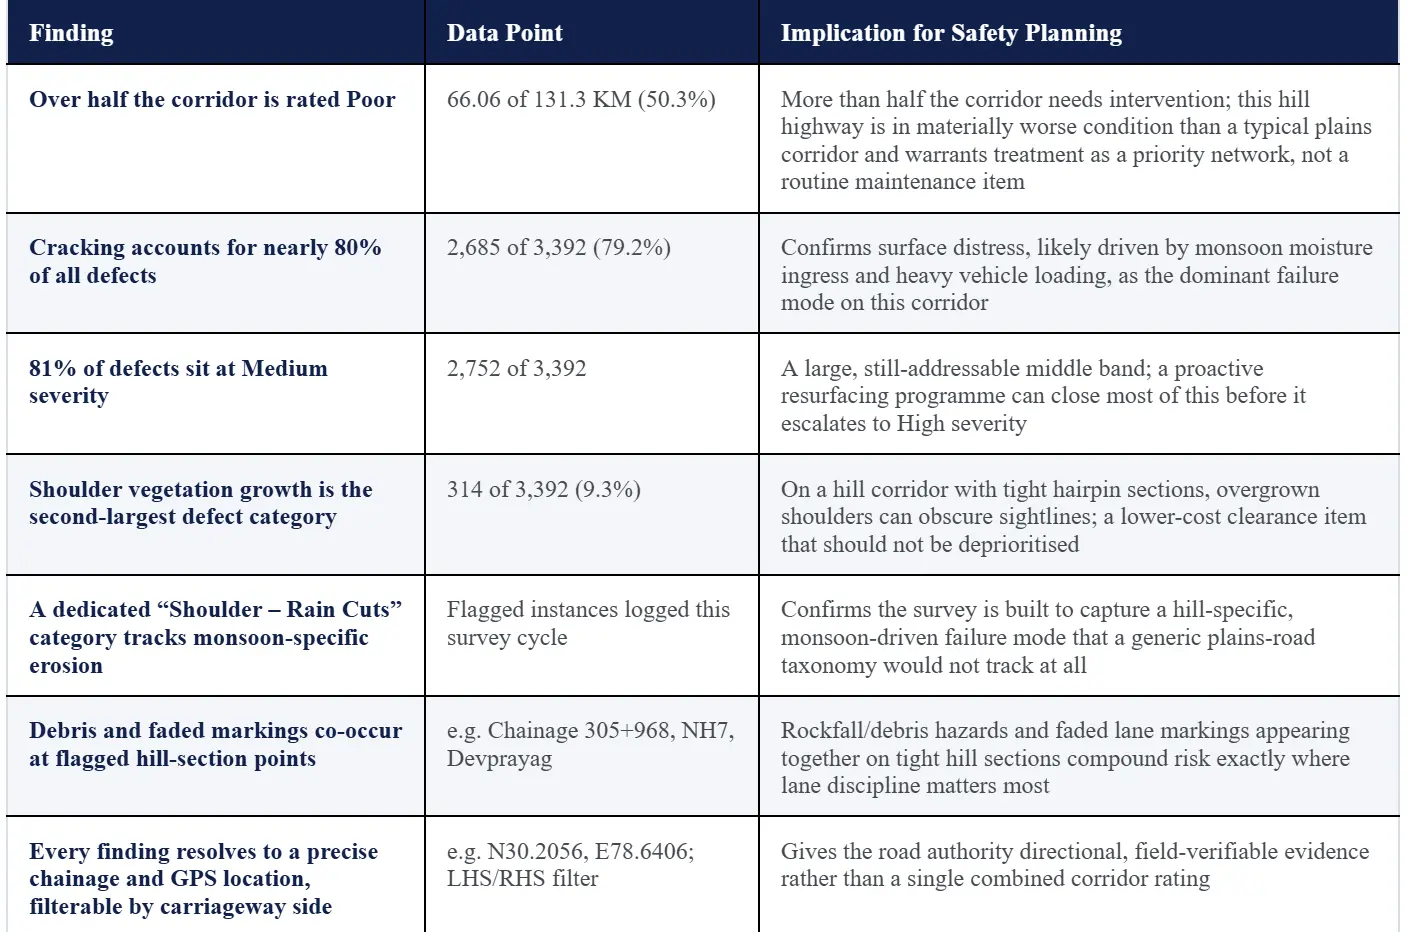
RoadVision AI's platform delivered five structured outputs from the Rudraprayag Highway survey each built to move a hill-corridor safety finding from detection through to a location-specific, field-actionable item.
The location-specific view for field verification
Good / Fair / Poor, by kilometre, across the full corridor
Every finding tagged by type and severity, not left as a general note
The visual layer behind every finding
Actionable output built for a safety-first maintenance programme
The Rudraprayag Highway survey gave the road authority a safety picture of one of Uttarakhand's most demanding corridors captured without exposing an inspection team to the terrain itself, and precise enough to act on immediately
For the first time, the full 131 km corridor has a consistent, chainage-level condition and defect baseline, rather than fragmented or infrequent manual observations.
LHS/RHS tracking lets the authority see and act on the asymmetric risk profile a hill highway actually has, instead of a single averaged rating.
Categories like Shoulder – Rain Cuts and debris-related Cleanliness findings reflect the terrain this corridor actually sits in, not a generic plains-road defect list
The same methodology can be re-run on this corridor, or extended to others in the region, without putting another inspection team at risk on hairpin terrain.
For state road authorities, PWD safety cells, and engineering teams managing Himalayan and other hill highway corridors.
RoadVision AI surveyed the full 131.3 km Rudraprayag Highway corridor along NH7, running through Devprayag and across the Tehri Garhwal and Pauri Garhwal districts of Uttarakhand, using a vehicle-mounted dashcam survey. The audit identified and classified 3,392 pavement and safety-relevant findings by severity, tracked condition separately by carriageway direction (LHS/RHS), and resolved every finding to a precise chainage and GPS location.
Hill highways carry risk profiles a plains-road survey isn't built to capture — hairpin bends with limited sightlines, monsoon-driven shoulder erosion (tracked here as a dedicated Shoulder – Rain Cuts category), rockfall and debris hazards, and carriageways that run directly alongside cliffs or river gorges. A dashcam-based AI survey covers this terrain without requiring an inspection team to stop or walk any section, which is precisely where a traditional manual audit is hardest, and most hazardous, to run.
On a corridor like this one, the two carriageway directions can face genuinely different risk: one side may run against a rock face prone to debris, while the other runs along a drop-off toward the river valley below. Tracking findings separately by carriageway side means the road authority can see and act on that asymmetry directly, rather than working from a single combined rating that blends two very different risk profiles into one number.
66.06 of the 131.3 km surveyed just over half falls in the Poor condition band. For a corridor of this significance, that number supports treating it as a priority network for near-term intervention rather than folding it into routine, lower-urgency maintenance scheduling. The chainage-level data behind that headline figure lets the authority sequence exactly which stretches to address first.
The Autonomous Road Engineer
AI-powered road condition monitoring, asset management, & infrastructure intelligence helping agencies move from reactive maintenance to predictive road management.


.webp)
.webp)
.webp)