
Type "how does AI detect potholes" into a search bar and you'll get a reasonable answer about cameras and machine learning. But that question only scratches the surface of what's actually happening and it leaves out something important: potholes are just one of at least half a dozen distinct types of roadway surface defects that AI systems are now trained to find, each with its own visual signature, underlying cause, and detection challenge. A system built only to spot potholes will miss the rutting, raveling, and bleeding that often show up on the same stretch of road and each of those tells engineers something different about what's actually wrong with the pavement.
This blog answers the fuller question: how does AI actually detect potholes and the broader family of roadway surface defects, what does each defect type look like to a computer vision model, and why does distinguishing between them matter as much as finding them in the first place?
Before getting into the "how," it helps to know the "what." Roadway surface defects generally fall into a few recognizable categories, each with distinct visual and physical characteristics:
Each of these requires the AI model to recognize a different combination of shape, texture, and context which is why the strongest systems don't rely on a single generic "defect detector," but on models trained specifically to distinguish between these categories.
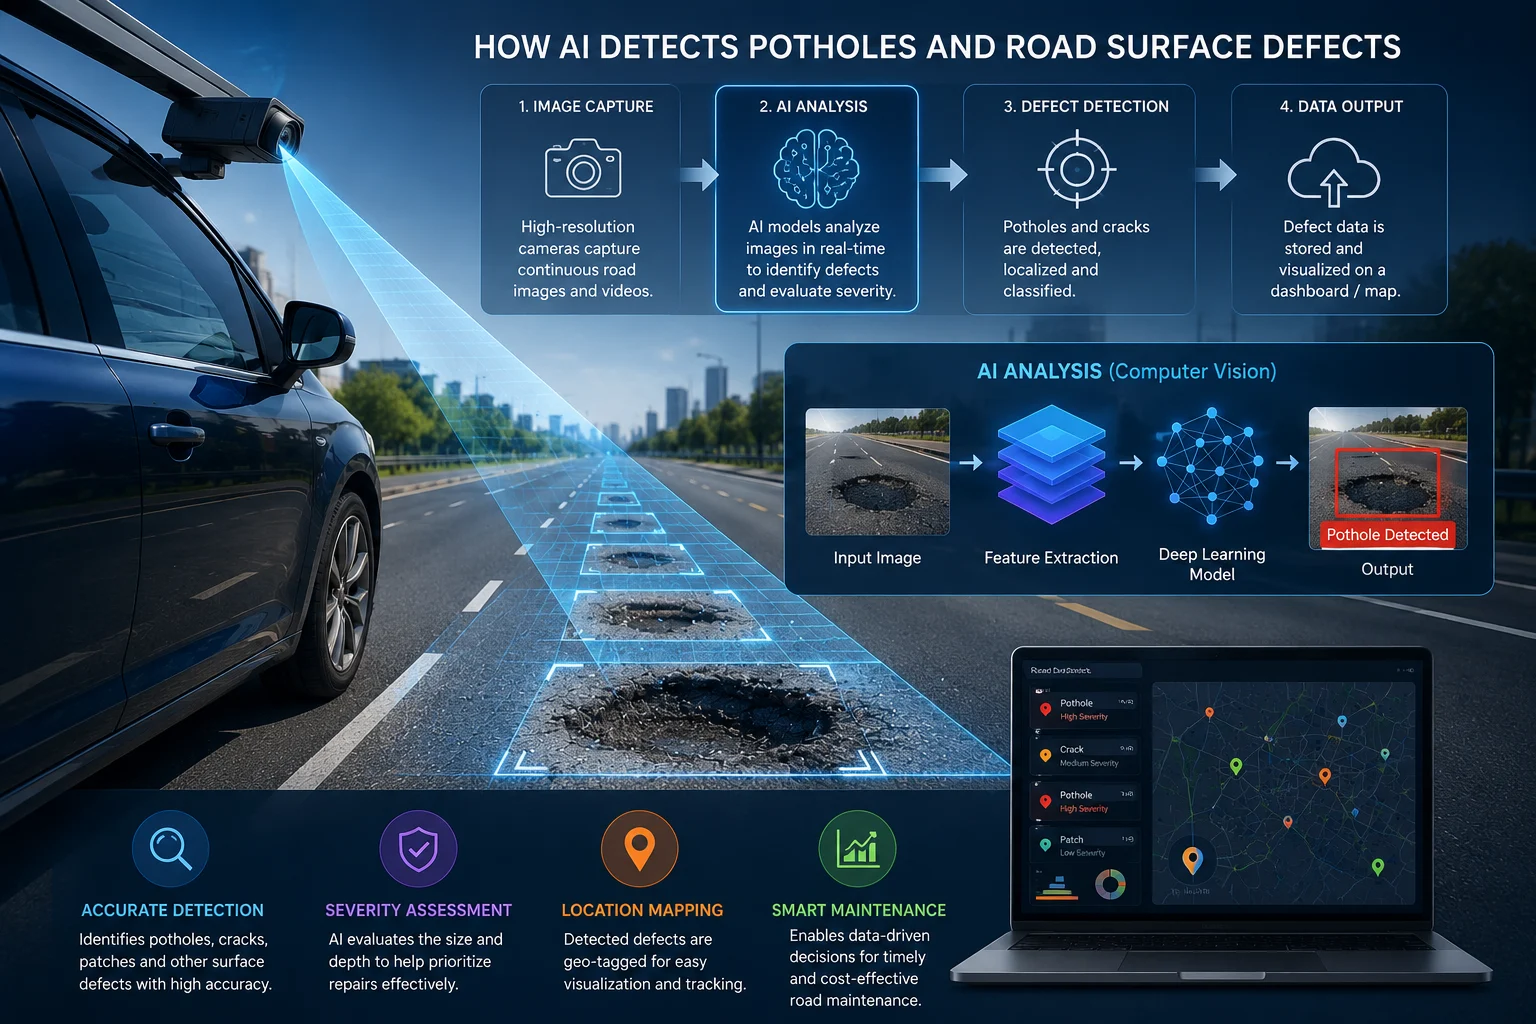
Potholes present a fairly distinctive visual pattern: an irregular, roughly circular or oval depression, often with darker shadowing inside the cavity due to depth, and lighter-colored broken edges where the surrounding pavement has fractured away.
AI models typically convolutional neural networks (CNNs) or object detection architectures like YOLO (You Only Look Once) or Faster R-CNN are trained on large datasets of labeled pothole images captured across different lighting conditions, road surfaces, and pothole sizes. The model learns to recognize the combination of shadow patterns, edge irregularity, and surface discontinuity that distinguishes a genuine pothole from a shadow, a manhole cover, or a patch of dark staining.
More advanced systems go beyond simple detection to estimate pothole depth and size, often using stereo camera setups or combining visual data with LiDAR to generate a rough 3D profile, which supports better severity classification and repair prioritization than a simple "pothole present" flag.
Because visual detection alone can occasionally mistake shadows or debris for potholes, many systems combine camera data with accelerometer and vibration sensor readings when a vehicle's suspension registers an impact at the same location and moment as a visual detection, confidence in the finding increases significantly.
Cracking is where defect classification gets genuinely complex, because different crack patterns indicate fundamentally different underlying problems.
AI models recognize this by its distinctive interconnected, polygonal pattern resembling reptile skin typically concentrated in wheel paths. This pattern recognition relies heavily on the model learning the specific geometry of interlocking crack networks, not just detecting "cracks are present."
The model distinguishes block cracking by its larger, more rectangular crack pattern spread relatively uniformly across the pavement, rather than concentrated in wheel paths location and pattern spacing are both key inputs to correct classification.
These present as relatively straight-line cracks, and AI models classify them based on orientation relative to the direction of travel (perpendicular for transverse, parallel for longitudinal), combined with regular spacing patterns that help distinguish them from random surface damage.
Detected specifically through positional analysis the model looks not just at crack shape but at proximity to the pavement's outer edge, since edge cracking is defined largely by where it occurs, not how it looks in isolation.
Rutting is fundamentally different from cracking because it's a deformation, not a fracture which means standard 2D image analysis alone often isn't sufficient.
Rutting detection typically relies on LiDAR, stereo cameras, or structured light sensors to generate a 3D surface profile of the pavement, since rutting is defined by depth and cross-sectional shape (a longitudinal depression in the wheel path) rather than surface color or texture changes alone.
AI models analyze the transverse profile of the road surface, measuring the depth and width of any depression in the wheel path zones specifically, distinguishing genuine structural rutting from routine pavement texture variation.
Raveling appears as a rough, pitted surface texture where individual aggregate particles have progressively worn away, giving the pavement a grainy, weathered appearance rather than a distinct crack or hole.
Because raveling is a texture-based defect rather than a discrete shape, AI models rely more heavily on texture analysis techniques examining surface roughness patterns and aggregate exposure across an area rather than the edge-detection and shape-recognition approaches used for potholes or cracking.
Bleeding appears as a dark, often shiny or reflective patch where excess asphalt binder has risen to the pavement surface, typically most visible in warm conditions when the binder softens.
AI models trained to detect bleeding look for a distinct combination of color saturation and surface reflectivity that differs from both normal pavement and other defect types, since bleeding's shiny, uniform appearance is visually quite different from the rough or fractured textures of cracking and raveling.
Shoving creates a visible wave-like or rippled distortion in the pavement surface, typically concentrated near intersections, stop signs, or other locations where vehicles brake and accelerate frequently.
Similar to rutting, shoving detection benefits significantly from 3D surface profiling rather than 2D imagery alone, since the defining characteristic is surface deformation rather than a purely visual pattern though location context (proximity to intersections) also serves as a useful supporting signal for classification.
A system that can only say "something's wrong here" is meaningfully less useful than one that can say "this is fatigue cracking, moderate severity, likely to progress to potholing within the next maintenance cycle." Accurate classification across defect types matters for several concrete reasons:
Cameras, and increasingly LiDAR or depth sensors, mounted on survey vehicles, fleet vehicles, or drones capture continuous imagery and, where available, 3D surface data as the vehicle travels.
Rather than running separate models for each defect type, most modern systems use a single multi-class detection model commonly built on architectures like YOLO or Faster R-CNN that simultaneously identifies and classifies multiple defect types within the same pass over the imagery.
For defects like raveling, rutting, and shoving that depend more on surface texture or depth than discrete shape, models incorporate additional texture-analysis or 3D profiling techniques alongside standard object detection.
Because defect location within the lane (wheel path, edge, uniform spread) and roadway context (near an intersection, for example) are strong classification signals, effective systems incorporate positional data as an input to the classification process, not just visual appearance alone.
Detected defects are scored for severity based on size, depth, density, and progression indicators, supporting prioritized maintenance recommendations rather than a flat list of equally-weighted findings.
Every detection is tagged with precise GPS location and compiled into structured, exportable data that integrates with GIS systems and maintenance work order platforms.
"How does AI detect potholes" is really the entry point to a much bigger and more useful question: how does AI detect roadway and correctly classify the full range of roadway surface defects that determine how a road actually needs to be maintained? Potholes, fatigue cracking, block cracking, edge cracking, transverse cracking, rutting, raveling, bleeding, and shoving each carry a distinct visual and physical signature and modern computer vision systems are increasingly capable of telling them apart reliably, at scale, across an entire road network. That distinction matters because it's what turns raw defect detection into genuinely actionable maintenance intelligence.
RoadVision AI's computer vision models are trained to detect and classify the full spectrum of roadway surface defects not just potholes including fatigue, block, edge, and transverse cracking, rutting, raveling, bleeding, and shoving. Get structured, severity-scored defect data that actually tells you what's wrong and what to do about it, not just where something looks off.
Want to see multi-defect AI detection applied to your road network? Talk to the RoadVision AI team to learn more or request a demo.
AI uses computer vision models trained on labeled pothole imagery to recognize the irregular shape, shadowing, and broken edges characteristic of potholes, often combined with vibration sensor data to confirm genuine physical depressions.
AI can detect and classify fatigue cracking, block cracking, edge cracking, transverse cracking, rutting, raveling, bleeding, and shoving, each identified through distinct visual patterns, textures, or 3D surface profiles.
Different defect types require different repair treatments and indicate different underlying causes, so accurate classification directly affects whether maintenance dollars are spent on the right fix.
Rutting is a surface deformation rather than a fracture, so AI systems typically rely on LiDAR or stereo camera-based 3D surface profiling to measure depth and cross-sectional shape, rather than standard 2D image analysis used for cracking.
Yes, more advanced systems estimate severity based on size, depth, density, and progression indicators, supporting prioritized repair recommendations rather than a simple presence/absence flag.
Common technologies include convolutional neural networks, object detection frameworks like YOLO or Faster R-CNN, LiDAR or depth sensors for 3D profiling, and sensor fusion with accelerometer data for validation.

The Autonomous Road Engineer
AI-powered road condition monitoring, asset management, & infrastructure intelligence helping agencies move from reactive maintenance to predictive road management.


.webp)
.webp)
.webp)